


INTRODUCTION
Colorectal cancer (CRC) is the third most common cancer and the second most common cause of cancer-related death worldwide [1]. It is therefore essential to investigate the prognostic factors of CRC.
The influence of systemic inflammation in various carcinomas has been widely reported in recent years [2, 3]. In addition, multiple biomarkers of systemic inflammation have been developed, including the prognostic nutritional index (PNI) [4], the neutrophil to lymphocyte ratio (NLR) [5], and the modified Glasgow Prognostic Score (mGPS) [6], all of which have been reported to be related to CRC prognosis. While mGPS uses C-reactive protein (CRP) and albumin levels, CRP to albumin ratio (CAR) is a calculated value developed by Fairclough et al. [7].
CAR has been reported to be useful in predicting disease outcomes such as sepsis [8], acute pancreatitis [9], and ulcerative colitis [10]. Furthermore, it has been reported to be a useful biomarker in various carcinomas, including gastric cancer [11], esophageal cancer [12], pancreatic cancer [13], gallbladder carcinoma [14], and ovarian cancer [15]. Both CRP and albumin, factors used in CAR, are synthesized in the liver. Chronic systemic inflammation induced by cancer cells increases CRP synthesis and decreases albumin synthesis in the liver. These 2 factors are indirect measures of systemic inflammation, metabolic abnormalities, and cachexia [16].
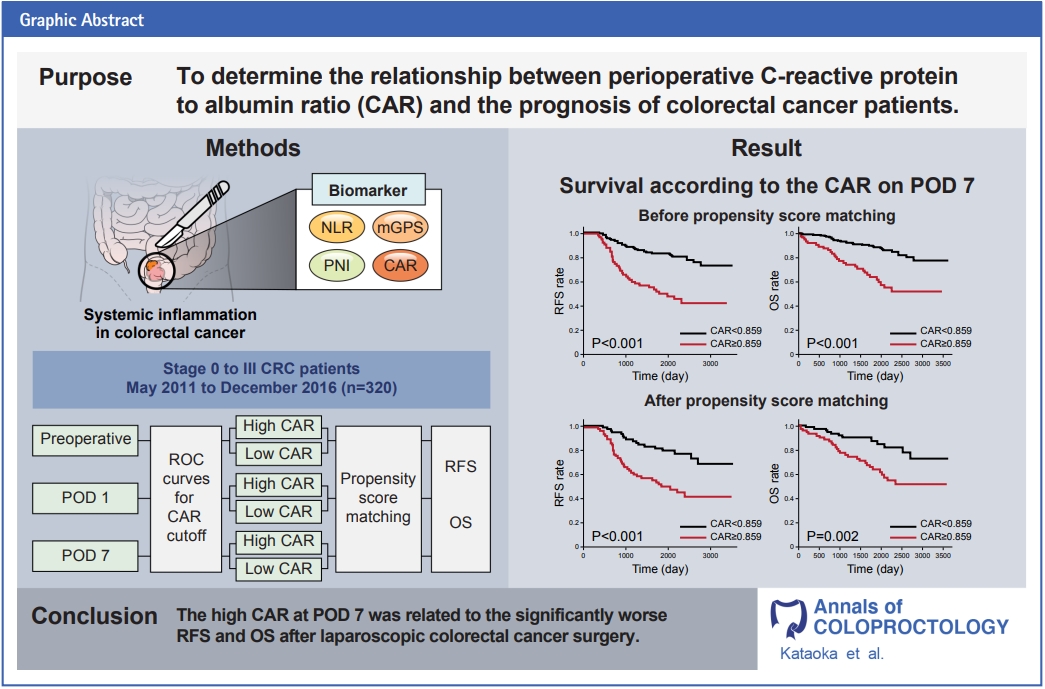
CAR has been associated with CRC prognosis [17, 18]. However, the impact of perioperative CAR on the prognosis of CRC after surgery has not been thoroughly investigated. The purpose of this study is to evaluate the influence of preoperative and postoperative CAR on relapse-free survival (RFS) rates and overall survival (OS) rates for CRC patients who underwent radical resection.
METHODS
Chart reviews were conducted retrospectively on 362 patients with CRC who underwent laparoscopic resection at Suwa Red Cross Hospital (Nagano, Japan) from May 2011 to December 2016. Patients with metastasis, residual tumor, recurrent CRC, or synchronous malignancy were excluded. A total of 320 patients were included in the analysis. Informed consent was obtained from the patients for this study, and the study protocol was approved by the Ethics Committee of Suwa Red Cross Hospital (No. 3-22).
Clinical variables, such as age, sex, the American Society of Anesthesiologists (ASA) physical status (PS) classification, preoperative carcinoembryonic antigen (CEA) level, preoperative carbohydrate antigen (CA19-9) level, tumor information (location, size, histotype, presence of lymphatic or venous invasion, and stage classification), and postoperative complications (grade II or higher on the Clavien-Dindo classification) were obtained from patient records. The resected CRC was staged using the TNM classification system of the 8th edition of the Union for International Cancer Control. The survival rate, recurrence status, and time to recurrence were also investigated. RFS rate and OS rate were used to evaluate them. RFS was defined as the period of time from the start of treatment that patients were alive with no evidence of cancer recurrence, while OS was defined as the period of time patients were alive from the start of treatment, regardless of the cause of death. Serum CRP and albumin levels at preoperative, the 1st postoperative day (POD 1), and the 7th postoperative day (POD 7) were analyzed, and CAR was calculated by dividing the CRP level (mg/dL) by the albumin level (g/L).
We used EZR software (R Foundation for Statistical Computing) for statistical processing. The cutoff values for each CAR at preoperative, POD 1, and POD 7 were determined by analyzing the receiver operating characteristic (ROC) curves for survival rate. Patients were divided into 2 groups based on the cutoff value: the high CAR and low CAR groups. In addition, propensity score matching was used to minimize any potential confounding bias between the 2 groups that might affect prognosis. We performed a 1:1 matching without replacement through the nearest available matching, with the caliper set at 0.2. Each patient was propensity scored, based on a logistic regression model addressing the following 11 variables: age, sex, ASA PS classification, serum CEA level, serum CA19-9 level, tumor location, tumor size, tumor histotype, lymphatic invasion, venous invasion, and TNM stage. The chi-square or Fisher exact tests tested differences in categorical variables, and survival rates (5-year RFS rate and 5-year OS rate) were analyzed using the Kaplan-Meier method. The P-values of < 0.05 were considered significant.
In addition, the multivariable Cox proportional hazard model was used to determine the hazard ratios (HRs) and 95% confidence intervals (CIs) for CAR of POD 7 for recurrence and survival, adjusting for age, sex, ASA PS classification, serum CEA level, serum CA19-9 level, tumor location, tumor size, tumor histotype, lymphatic invasion, venous invasion, and TNM stage.
RESULTS
Data from 320 patients with stage 0 to III CRC were collected for this study. With 5-year OS as the endpoint, the optimal cutoff value for CAR was determined using the area under the curve (AUC) of the ROC curve. The preoperative cutoff value was 0.038 (AUC, 0.666), the cutoff value on POD 1 was 2.007 (AUC, 0.649), and the cutoff value on POD 7 was 0.859 (AUC, 0.632).
Analysis of preoperative CAR
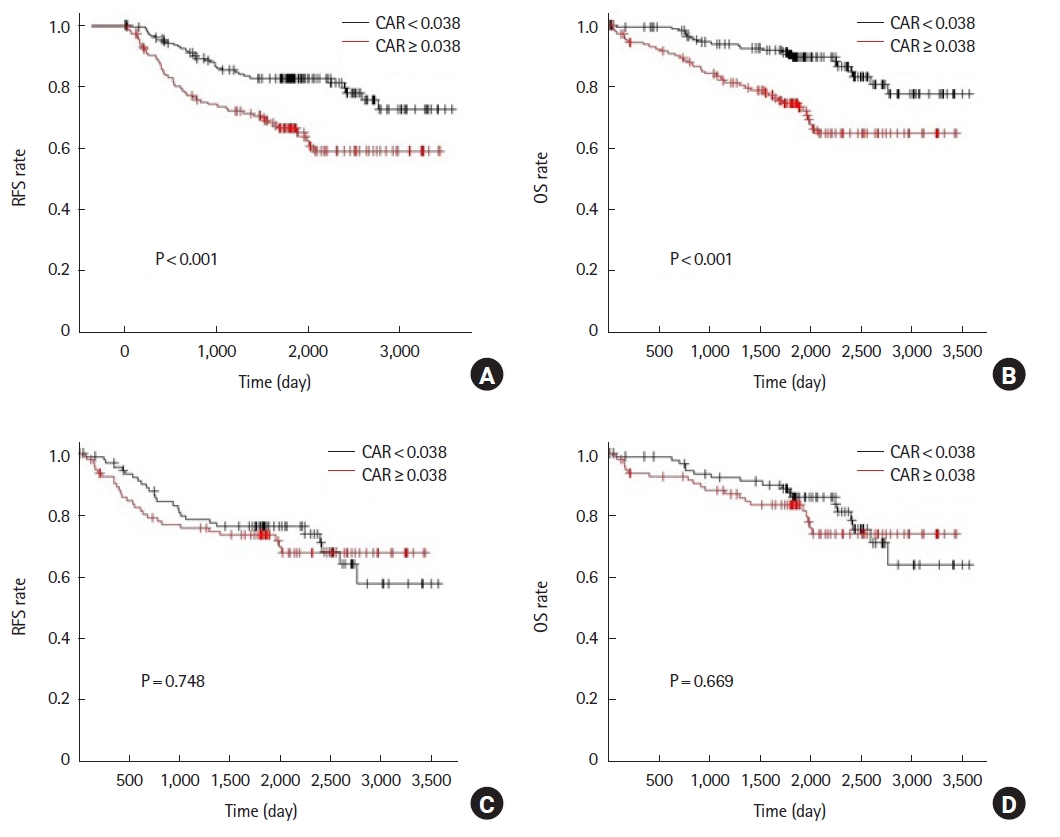
First, we reviewed preoperative CAR. Before propensity score matching, there were 144 patients in the high CAR group (CAR ≥0.038) and 176 patients in the low CAR group (CAR<0.038). Patients in the high CAR group were older than those in the low CAR group (73.82±10.79 years vs. 68.62±11.83 years, P<0.001) and had a higher proportion of males (59.7% vs. 46.0%, P=0.018). In addition, the high CAR group (vs. low CAR group) showed significant differences in ASA PS classification (P<0.001), preoperative CEA (≥5 ng/mL; 48.6% vs. 30.1%, P=0.001), tumor size (≥50 mm; 47.2% vs. 15.3%, P<0.001), lymphatic invasion (54.9% vs. 40.9%, P=0.014), venous invasion (51.4% vs. 33.0%, P=0.001), and pathological stage (P<0.001). The 2 groups were then propensity score matched in a 1:1 ratio (93 patients per group), and there were no differences between groups (Table 1). There was no significant difference in postoperative complications either before or after propensity score matching.
Before propensity score matching, the 5-year RFS was 66.4% in the high CAR group compared to 82.7% in the low CAR group (P<0.001). Also, 5-year OS was 74.5% in the high CAR group and 89.5% in the low CAR group (P<0.001) (Fig. 1A, B). After propensity score matching, the results showed that 5-year RFS was 73.3% in the high CAR group and 76.1% in the low CAR group (P=0.784). The 5-year OS was 83.0% in the high CAR group and 85.7% in the low CAR group (P=0.669) (Fig. 1C, D).
Analysis of CAR on POD 1
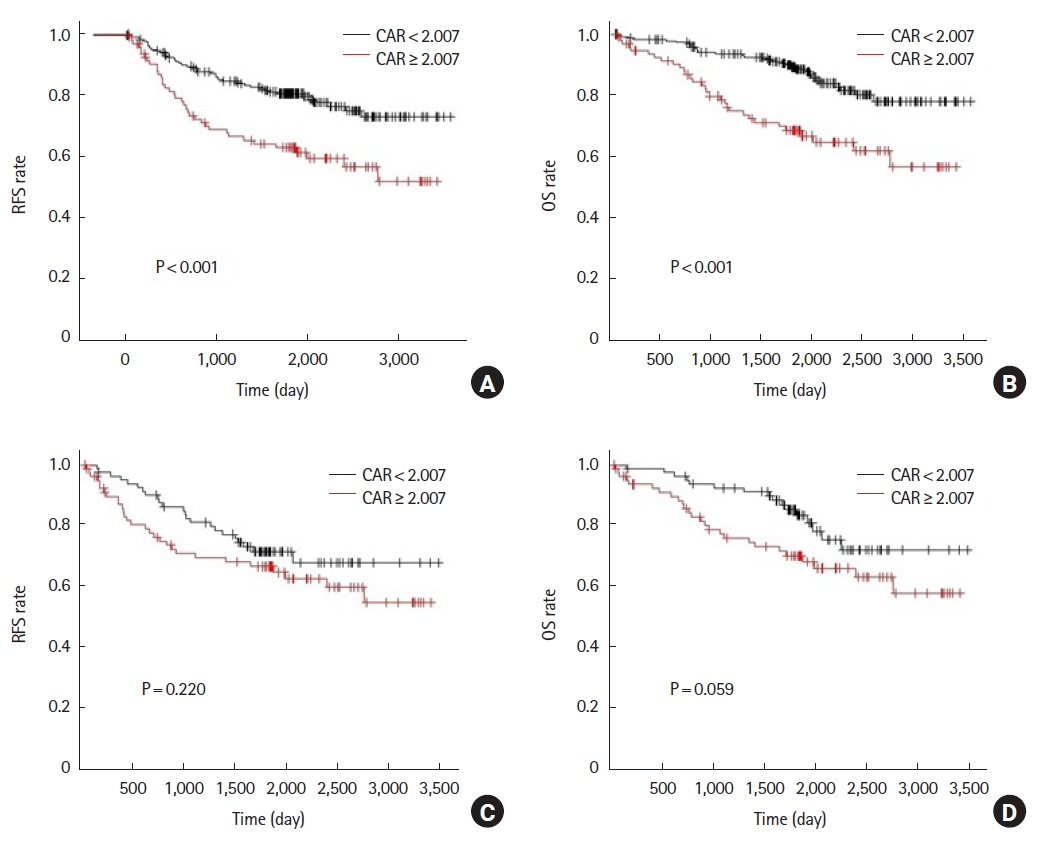
Second, we reviewed CAR of POD 1. Before propensity score matching, there were 95 patients in the high CAR group (CAR ≥2.007) and 225 patients in the low CAR group (CAR<2.007). The high CAR group (vs. low CAR group) showed significant differences in age (74.0±11.2 years vs. 69.7±11.6 years, P=0.002), ASA PS classification (P<0.001), preoperative CEA (≥5 ng/mL; 51.6% vs. 32.9%, P=0.002), tumor size (≥50 mm; 43.2% vs. 24.0%, P=0.001), lymphatic invasion (60.0% vs. 41.8%, P=0.003), venous invasion (52.6% vs. 36.4%, P=0.009), and pathologic stage (P=0.026). Next, the 2 groups were propensity score matched in a 1:1 ratio (81 patients per group), but no differences were observed between groups (Table 2). For postoperative complications, there was a significant difference even after propensity score matching.
Before propensity score matching, the 5-year RFS was 62.7% in the high CAR group and 80.5% in the low CAR group (P<0.001). Five-year OS was 68.4% in the high CAR group and 88.5% in the low CAR group (P<0.001) (Fig. 2A, B). After propensity score matching, 5-year RFS was 66.6% in the high CAR group and 71.5% in the low CAR group (P=0.220). Five-year OS was 70.1% in the high CAR group and 83.4% in the low CAR group (P=0.059) (Fig. 2C, D).
Analysis of CAR on POD 7
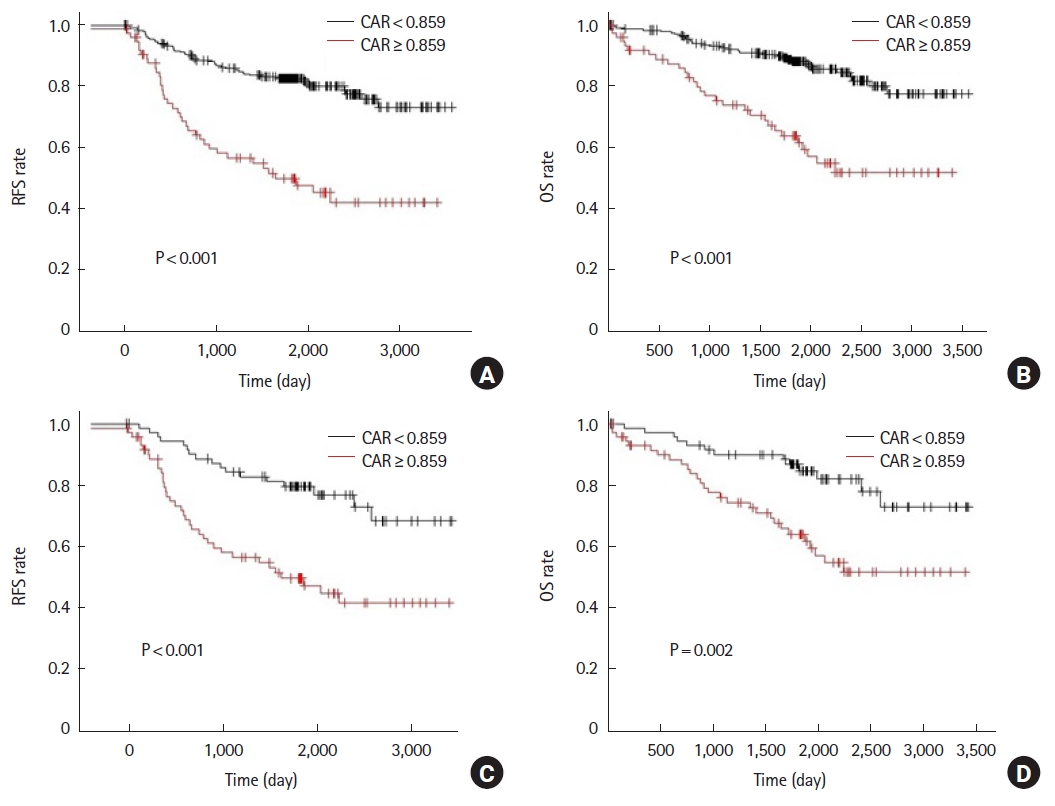
Finally, we reviewed the CAR of POD 7. Before propensity score matching, there were 75 patients in the high CAR group (CAR ≥0.859) and 245 patients in the low CAR group (CAR<0.859). The high CAR group (vs. low CAR group) was older (74.32±9.64 years vs. 69.94±12.02 years, P=0.004), consisted of a higher proportion of males (69.3% vs. 46.9%, P=0.001), and showed significant difference in ASA PS classification (P<0.001). The 2 groups were then propensity score matched at a ratio of 1:1, and the number of patients in both groups was 72 each, with no significant differences in any of the measured variables (Table 3). There was a significant difference in postoperative complications even after propensity score matching.
Before propensity score matching, the 5-year RFS was 50.0% in the high CAR group and 82.6% in the low CAR group (P<0.001). Five-year OS was 63.8% in the high CAR group and 88.1% in the low CAR group (P<0.001) (Fig. 3A, B). After propensity score matching, 5-year RFS was 49.6% in the high CAR group and 79.6% in the low CAR group (P<0.001). Five-year OS was 64.0% in the high CAR group and 84.6% in the low CAR group (P=0.002) (Fig. 3C, D).
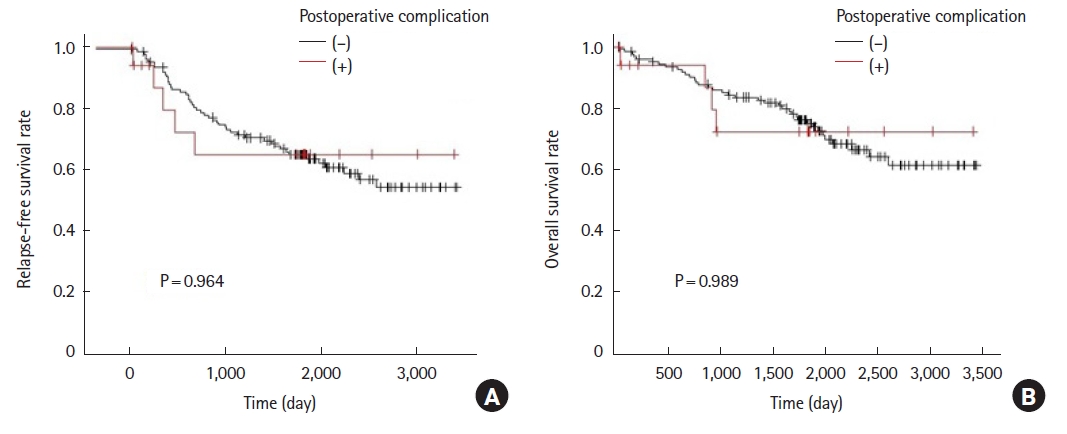
Out of the 144 patients selected by propensity score matching from POD 7 results, an additional comparison was made between patients with postoperative complications (19 patients) and patients without postoperative complications (125 patients). The 5-year RFS was 65.2% for patients with postoperative complications and 65.0% for patients without postoperative complications (P=0.989). Five-year OS was 72.4% in patients with postoperative complications and 75.0% in patients without postoperative complications (P=0.964) (Fig. 4). The results showed that the presence of postoperative complications did not affect survival rate.
As shown above, before propensity score matching, all CARs of preoperative, POD 1, and POD 7 were associated with prognosis. However, after propensity score matching and background equalization, only the CAR of POD 7 was found to have a significant relationship with the prognosis of CRC patients.
Finally, a multivariable Cox proportional hazard model was used to analyze the CAR of POD 7. In the model, the HR for recurrence was 2.69 (95% CI, 1.70–4.26) for POD 7 with higher CAR (P<0.001). For survival, the HR for survival was 2.72 (95% CI, 1.60–4.63) for POD 7 with higher CAR (P<0.001). Thus, in this analysis, CAR of POD 7 was still an independent predictor of recurrence and survival, even after adjusting for each variable.
DISCUSSION
Various studies have shown that biomarkers such as PNI and NLR, which reflect systemic inflammation, are prognostic factors for malignancy [4, 5]. The mGPS, derived from serum albumin and CRP levels, is among these biomarkers and is predictive of prognosis in CRC patients [6]. CAR, which is calculated from the ratio of serum albumin to CRP, has also been used as a prognostic marker. Both albumin and CRP in serum are proteins synthesized in the liver. In the presence of inflammation, CRP synthesis is stimulated by inflammatory cytokines, while albumin synthesis is suppressed [19]. CAR therefore sensitively detects systemic inflammation, and preoperative CAR has been reported to have prognostic utility in gastric cancer [20], esophageal cancer [21], and gallbladder carcinoma [14].
In this study, there was no clear interrelationship between preoperative and POD 1 CAR and prognosis after propensity score matching. In contrast, CAR of POD 7 showed a strong relationship with prognosis even after propensity score matching and was regarded as an independent factor. Although it is not clear why these results were obtained, several factors may be involved.
It is conceivable that one of the factors explaining the temporal difference in the relationship between CAR and perioperative timing may be postoperative complications. It has been previously reported that postoperative complications in CRC surgery are associated with a poorer prognosis [22]. Complications within the first week after surgery may cause a prolonged inflammatory response reflected in the CAR of POD 7. In reality, however, the analysis showed that postoperative complications were not related to prognosis in this case group, and the effect was not significant. Therefore, other factors may have been present.
One possible factor is that CAR reflects the postoperative systemic inflammation caused by the residual tumor cells. Malignant tumors are known to produce inflammatory cytokines [23]. It has been reported that the local immune response and systemic inflammation caused by malignant tumors affect the survival rate of cancer patients [2]. Residual cancer cells may prolong the postoperative inflammatory response, resulting in a poor prognosis for patients. However, it is unclear how microscopic cancer cells in patients who have undergone curative resection will affect the body, and it is questionable whether they can cause a prolonged inflammatory state.
On the other hand, there is a report that surgical stress and postoperative acute phase reactants may promote tumor survival and growth after tumor resection [23]. It has also been reported that surgical stress increases the expression of E-selectin in vascular endothelial cells, which in turn may increase postoperative hematogenous metastasis [24]. According to these reports, the inflammation itself worsens the prognosis by creating an environment more conducive to cancer metastasis and growth. The impact of high invasiveness of surgery on the prognosis of patients cannot be denied, and reducing the invasiveness may improve the prognosis of patients.
The impact of high levels of inflammatory markers on POD 7 on recurrence of malignancy has been reported elsewhere. Hayama et al. [25] reported that the NLR of POD 7 was a significant predictor of reduced RFS in stage II postoperative CRC patients. In esophageal cancer, Ibuki et al. [26] reported that RFS was significantly reduces when CRP levels were high on POD 7. As shown in these studies and the present study, postoperative inflammation is associated with recurrence and prognosis, and therefore, merits further investigation.
Our study has several limitations. First, this is a retrospective, single-center study. Although propensity score matching has been performed, the possibility of random error, selection bias, and confounding cannot be ruled out. A multicenter, prospective study would strengthen the level of evidence. Second, there is no consensus cutoff value for CAR, which makes it difficult to apply clinically at this point. In this study, we used the ROC curve to determine the cutoff values for each day, but it may be necessary to calculate these values in a more extensive study. Finally, it is unclear whether any intervention in patients with high POD 7 CAR would improve their prognosis. Further research is needed to address this critical point.
In conclusion, the results of propensity score matching showed that CAR on POD 7 was an independent prognostic factor for RFS and OS in patients with CRC after radical resection; however, no relationship was found for preoperative or POD 1 CAR. Patients with high CAR on POD 7 may require adjuvant chemotherapy and more careful management.