


INTRODUCTION
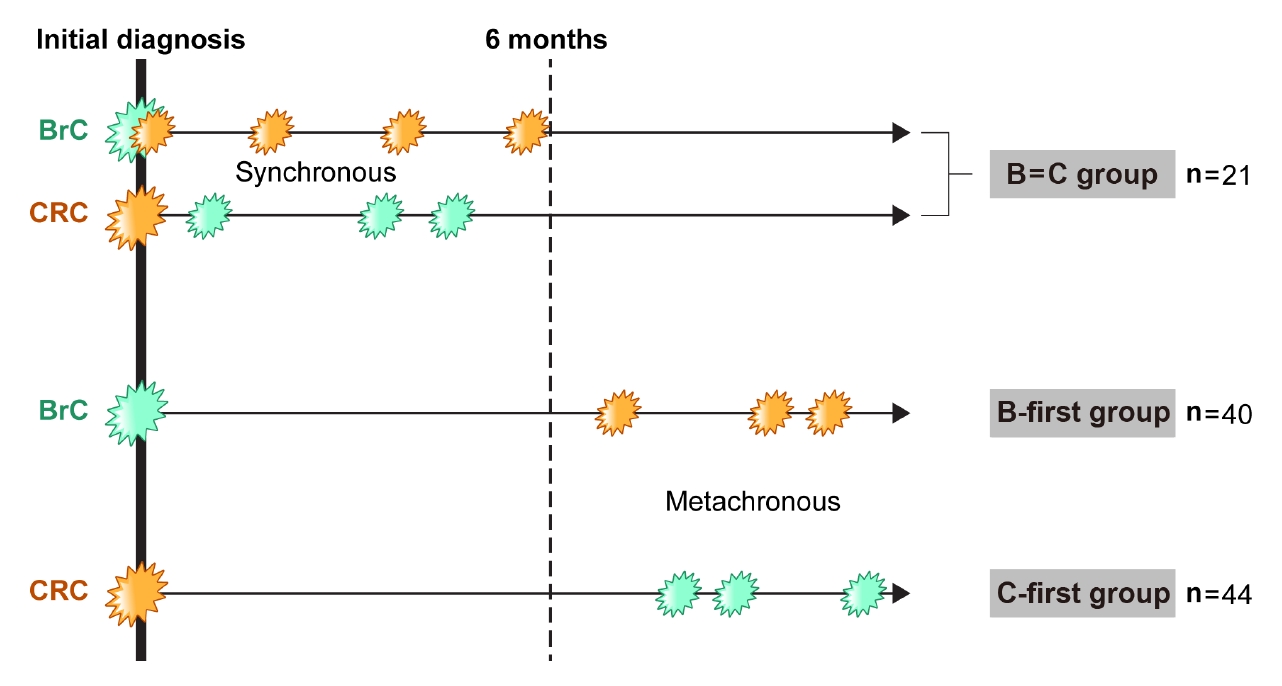
The survival of cancer patients has significantly improved through advances in cancer treatment and early diagnosis. However, patient survival in cases with multiple primary cancers which occur simultaneously is not yet known. Multiple primary cancers are defined as more than one cancer in the same individual and are classified by the time of occurrence of each cancer. Synchronous cancer is defined as each cancer occurring simultaneously or within a period of 6 months, while metachronous cancer is defined as being diagnosed with secondary cancer 6 months or more after the primary cancer diagnosis [1]. In epidemiological studies, the frequency of multiple primary cancers is reported to be in the range of approximately 2% to 17% [2, 3].
Breast cancer (BrC) and colorectal cancer (CRC) are the most common malignancies in women except for thyroid cancer [4, 5]. There have been several studies on the possibilities of association between BrC and CRC, especially about the incidence of CRC in BrC patients. Some studies have reported that BrC increases the risk of CRC [6-9] and vice versa [10-12]. Recent studies reported related genetic factors in patients with the BrC-CRC phenotype [13]. Fisher et al. [14] reported the outcomes of patients who are diagnosed with both breast and CRC using SEER (Surveillance, Epidemiology, and End Results) data. However, the SEER database does not contain many variables, which affect survival. Since these 2 cancers are the leading causes of cancer deaths in women, it is necessary to investigate the incidence and prognosis of patients diagnosed with both cancers. Thus, we aimed to investigate the clinicopathologic features and prognosis of patients who were diagnosed with breast and CRC synchronously or metachronously.
METHODS
Study population and definition of double primary cancers
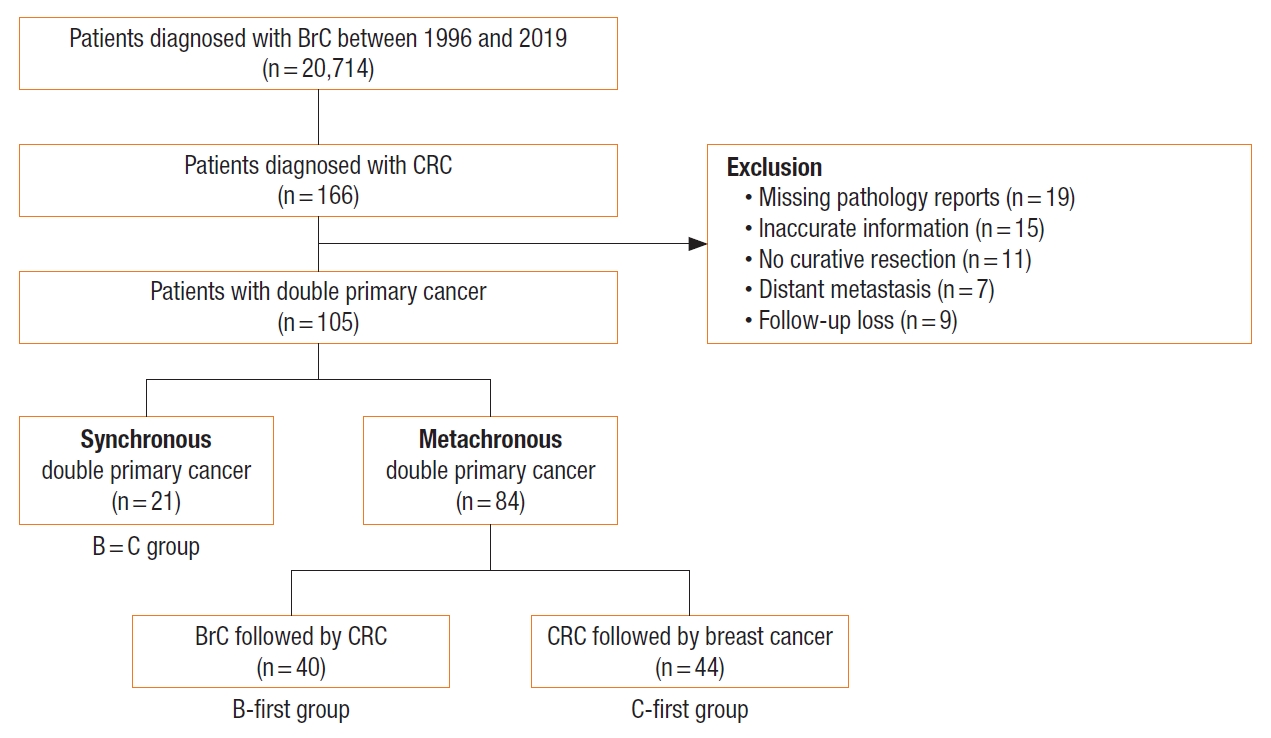
Between July 1996 and March 2019, there were 20,714 patients who were diagnosed with BrC in the Severance Hospital and Gangnam Severance Hospital, Seoul, Korea. Among them, 166 patients who were also diagnosed with CRC were evaluated retrospectively. Patients who did not undergo curative resection were histologically not confirmed or had metastases at the time of diagnosis. Patients who were diagnosed with both breast and CRC synchronously within 6 months were defined as belonging to the B=C group. BrC patients who were diagnosed with CRC more than 6 months later were defined as the B-first group, while the CRC patients who were diagnosed with BrC at least 6 months later were defined as the C-first group (Fig. 1). A total of 105 patients were divided into the B=C group of 21 patients and metachronous groups of 84 patients according to the time of diagnosis of each cancer. Among the metachronous double primary cancer patients, there were 40 patients in the B-first group and 44 patients in the C-first group (Fig. 2). Data were gathered from the electronic medical recording system of Yonsei University Health System and were analyzed retrospectively. The study was carried out in accordance with the Declaration of Helsinki and was approved by the Institutional Review Board of Gangnam Severance Hospital (No. 3-2021-0165) with a waiver for informed consent.
Evaluation of the clinicopathological parameters
The data of patient characteristics were collected such as sex, age at diagnosis, body mass index (BMI) at diagnosis, comorbidities, past medical histories, and family histories. Clinicopathologic variables related to BrC such as tumor location, type of histology, T stage, lymph nodes (LN) metastasis, type of adjuvant treatments, TNM stage, estrogen receptor (ER), progesterone receptor (PR), Ki-67, human epidermal growth factor receptor 2 (HER2), and type of molecular classification were especially noted. In the case of CRC, tumor location, type of surgical treatment, histologic differentiation, T stage, LN metastasis, and TNM stage were evaluated. Molecular classification of BrC was performed using the surrogate definitions from St. Gallen Consensus 2013 [15]. TNM stage of each cancer was determined according to American Joint Committee on Cancer cancer stage manual, 8th edition [16].
Statistical methods
The associations of the 3 different groups and the continuous variables were evaluated using analysis of variance or independent 2-sample t-test. The chi-square or Fisher exact test was used to compare clinicopathological characteristics of patients for dichotomous variables. Overall survival was calculated from the date of diagnosis of the first cancer. Survival curves were plotted using the Kaplan-Meier method, and group differences in survival were evaluated by the log-rank test. Cox proportional hazard model was used to identify variables that were independently associated with overall survival. All statistical tests were 2-sided, and P<0.05 was considered statistically significant. Statistical analyses were carried out using the IBM SPSS Statistics ver. 25.0 (IBM Corp., Armonk, NY, USA).
RESULTS
Patient characteristics
In the C-first group, there was only 1 male patient. The mean ages at diagnosis of the first primary cancer were 63.0 years in patients of the B=C group, 57.0 years for the B-first group, and 59.6 years for the C-first group. The ages upon diagnosis of the second primary cancer were 62.5 years in the B-first group and 64.7 years in the C-first group. There were no significant differences among the 3 groups regarding the age upon diagnosis of both the first and second primary cancers. The intervals of diagnosis between breast and CRC were 67.1 months in the B-first group and 59.3 months in C-first group. While the patients of the B-first group had higher rates of diabetes mellitus, there was no significant difference for BMI, previous cancer histories, and familial cancer histories among the groups. Carcinoembryonic antigen (CEA) level at the diagnosis of BrC in the B=C group was 8.1 ng/mL and 8.5 ng/mL for CRC. Tumor markers for CEA and carcinoma antigen 15-3 at the diagnosis of BrC and CRC were significantly different among the groups (Table 1).
Clinicopathological characteristics of breast cancer
The tumor location of BrC was not significantly different among the groups. There was 1 patient each with bilateral BrC in both the B-first group and the C-first group. Invasive ductal carcinoma was the most common histologic type in all groups. T1 stage for BrC was 52.4 %, 45.0%, and 61.4% for the B = C group, B-first group, and C-first group, respectively. The rate of LN metastasis was 14.3%, 32.5%, and 20.5% for the B=C group, B-first group, and C-first group, respectively. For the TNM stage, stage I was most the common, followed by stage II for BrC. In the B-first group, 57.5% received chemotherapy, which was higher than the B=C or C-first group (P<0.001). The expression of ER, PR, and HER2 and the median value of Ki-67 were not significantly different among the 3 groups. For the molecular classification, the rate of patients with triple negative was 60.0% in the C-first group, 30% in the B-first group, and 9.5% in the B=C group. However, there was no significant difference for molecular classification among groups (Table 2).
Clinicopathological characteristics of colorectal cancer
Regarding tumor location of CRC, a left-sided tumor involving rectal cancer was more common than right-sided cancer. The rate of rectal cancer was 23.8%, 37.5%, and 40.9% for the B=C group, B-first group, and C-first group, respectively. In the B-first group, 20% of the patients were treated by endoscopic submucosal resection, while for the B=C group and C-first group, 95.2% and 95.5% received surgical treatments, respectively (P=0.044). Adenocarcinoma was the most common histologic type in all groups. T3 was the most common T stage, with no significant difference among the groups. The rate of regional LN metastasis was 42.9% in the B=C group, 22.5% in the B-first group, and 29.5% in the C-first group. However, there were no significant differences in tumor location, treatment, histologic type, and TNM stages for CRC (Table 3).
Survival outcomes
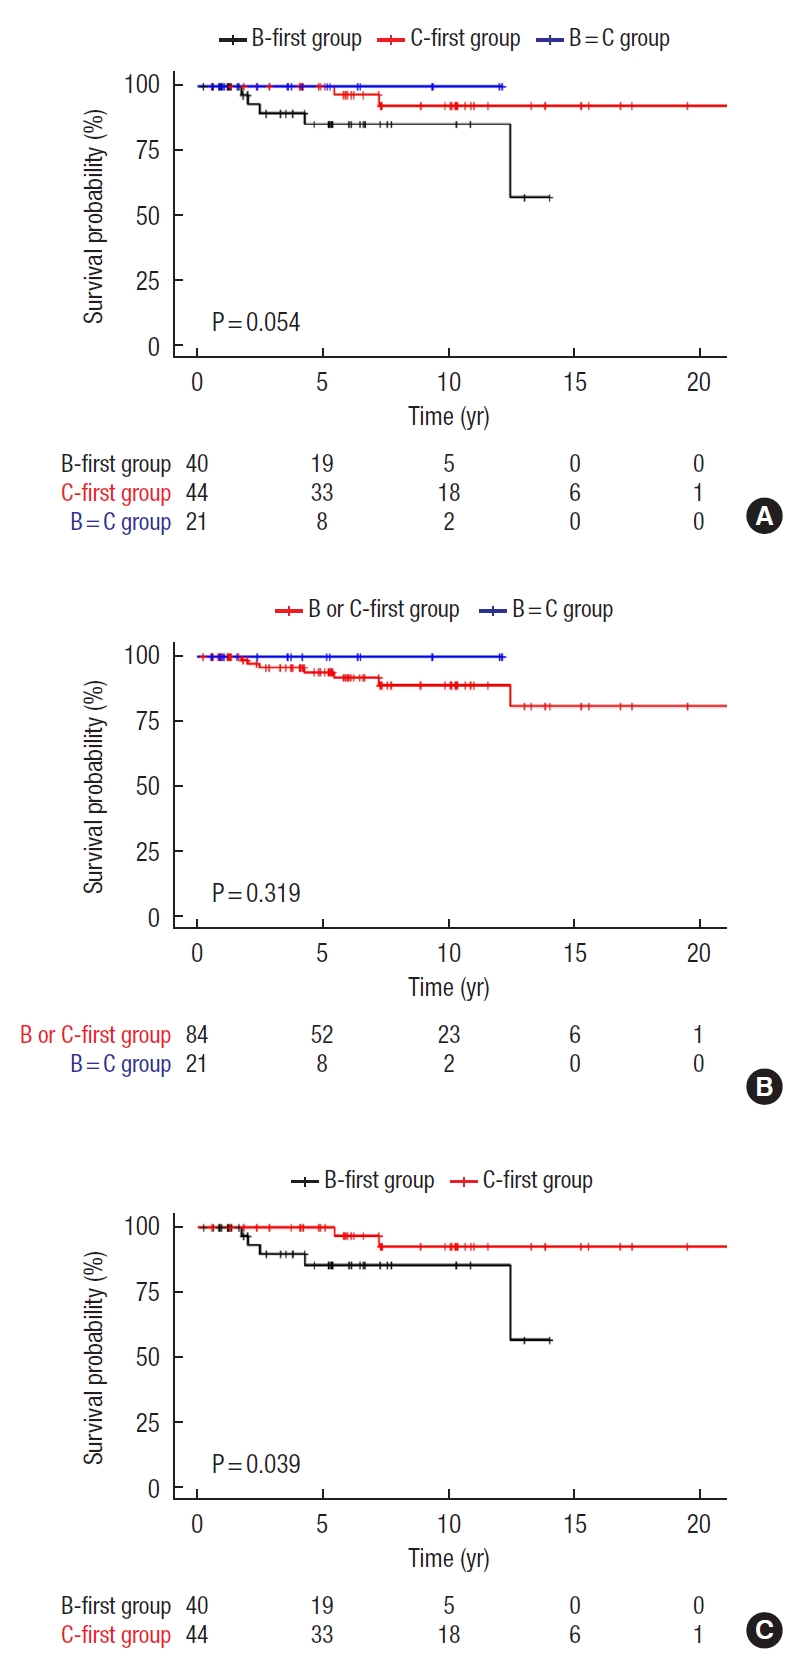
The median follow-up period was 13.9 years. The survival outcomes of B=C, B-first, and C-first groups are shown in Fig. 3A. In the survival analysis for all groups, the survival of the B-first group was poorer than the other groups with marginal significance (P=0.054). In the post hoc analysis, the overall survival between the B-first and C-first groups was significantly different (P=0.039). In contrast, the B = C group showed no significant difference in the survival outcomes with the B-first and C-first groups. In the survival comparisons between synchronous and metachronous cancers for BrC and CRC, there were no statistically significant differences between the 2 groups (P=0.319). In comparing the metachronous cancers between the B-first and C-first groups, the survival of the C-first group was better than the B-first group as shown in Fig. 3C (P=0.039). According to the TNM stages of CRC, there was no significant difference in survival among the 3 groups: stage I (P=0.407), stage II (P=0.346), and stage III (P=0.565) (Supplementary Fig. 1).
Prognostic factors of overall survival
In the univariate analysis for overall survival, there were no significant differences among the groups (hazard ratio [HR] of C-first group, 0.23 and B=C group, 0.22; P=0.086 and P=0.364, respectively). Ages at cancer diagnosis, tumor markers, histologic types, and TNM stages in both BrC and CRC showed no significant relations to overall survival. On the other hand, HER2 positivity increased the HR by 11.9 times for the overall survival (P=0.032). In addition, regional LN metastasis of CRC increased the HR by 5.81 times (P=0.036). However, hormone receptors and the molecular classification of BrC showed no significant outcomes affecting the overall survival. In the multivariate analysis, the HR of HER2 positivity was 7.07 and 5.44 for the CRC LN metastasis. However, the values for these variables were not found to be statistically significant (Table 4).
DISCUSSION
This study focused on evaluating the clinicopathologic and oncologic outcomes for patients who were diagnosed with both BrC and CRC. In patients with metachronous BrC and CRC cancers, the B-first group showed poorer overall survival outcomes compared to the C-first group. In addition, HER2 positivity and CRC LN metastasis were regarded as prognostic factors that affect overall survival.
With the advancement of early diagnosis and treatment, the survival of cancer patients has improved. However, it is not common for various cancers to occur in 1 patient; cases such as these are classified as having multiple primary cancer. In the epidemiological studies, the frequency of multiple primary cancers is reported to be in the range of 2% to 17% [2, 17]. CRC and BrC incidence is increasing in women in Korea. Except for thyroid cancer, both cancers are considered the most common cancer types [18]. This trend may be due to the westernized lifestyle, delayed marriage, and low fertility rate [19, 20]. This study analyzed 105 patients who were diagnosed with both CRC and BrC and divided them into synchronous and metachronous cancer patients. According to the International Association of Cancer Registries and International Agency for Research on Cancer standard, the synchronous and metachronous standards were divided into 6 months [1]. Metachronous cancer patients were divided into the BrC first diagnosed group (B-first group) and the CRC first diagnosed group (C-first group).
Regarding the clinical characteristic of the 3 groups, the prevalence of diabetes mellitus was significantly lower in the B = C group (P=0.01). Because diabetes mellitus is associated with the poor outcomes of BrC and CRC, it may influence the prognosis of the B=C group [21, 22]. In contrast, there was no significant difference among the groups in terms of hormonal receptors and pathologic results of BrC. However, in the treatment of CRC of the B-first group, higher rates of endoscopic resection were performed than surgical treatment. Considering the higher rates of receiving adjuvant chemotherapy for BrC in the B-first group, these results may affect the poorer survival of the B-first group than the other groups as shown in Fig. 3.
In the survival analysis for double primary cancers of BrC and CRC, Fisher et al. [14] reported that the risk of death from CRC was nearly 3 times that of BrC from the analysis of SEER data for both BrC and CRC. In this study, similar results were found; 4 cases of CRC-related deaths and 1 case of BrC-related death. Chapman et al. [23] reported that non-BrC-related deaths were more common than BrC-specific deaths in BrC patients, and osteoporosis caused by endocrine therapy is associated with increased risk of death from other malignancies. Thus, it is considerable that treatment of CRC can be more overweighed than BrC in similar stages.
In this study, it was seen that the B-first group had poorer overall survival than the C-first group. Though there were lower rates of surgical resection for CRC in the B-first group than in other groups (95.2% vs. 95.5% vs. 80.0%, B = C vs. C-first vs. B-first groups; P=0.044), early stages of CRC, which were treated via endoscopic resection, might not affect survival outcomes. In addition, the B-first group showed poorer overall survival than the C-first group despite no significant difference in TNM stages for both BrC and CRC. The selection bias limitation of our retrospective study might have influenced the poorer overall survival of the B-first group than of the C-first group (Fig. 3C). However, per the SEER data between 1988 and 2007 for patients with BrC and CRC, the cumulative risk of death was 3 times higher in CRC than in BrC because CRC-specific mortality increases while BrC-specific mortality decreased with time [14]. They suggested that the second cancer diagnosis in double primary cancers is more related to the risk of death. Considering the poorer survival of the B-first group than of the C-first group in our study, CRC screening is recommended to be undertaken after BrC diagnosis.
In the univariate analysis from Cox regression, the predictive factors of overall survival were CRC LN metastasis and HER2 positivity for BrC. LN metastasis of CRC is related to poor prognosis. Therefore, adjuvant chemotherapy is needed in patients with stage III CRC patients. In addition, the prognosis of BrC has improved when patients with HER2 positivity are given trastuzumab. In this study, HER2 positivity was one of the prognostic factors affecting overall survival in patients with double primary cancers of BrC and CRC. In recent clinical trials, the expression of HER2 receptor is considered to treat metastatic CRC patients [24, 25]. Although further studies are required, HER2 expression can be of significance in determining the appropriate adjuvant treatment for those with double primary cancers.
This study evaluated the clinicopathologic outcomes in patients with double primary cancers of BrC and CRC. However, there are several limitations. First, this study was based on retrospective data with a heterogeneous and small study population. The results of the multivariate analysis for overall survival with no statistical significance may be attributed to these limitations. A large cohort study is required to validate the outcomes of this study. Second, the patients included were only from Asia, especially Korea. The racial differences for the phenotypes of BrC and CRC should be considered in interpreting our outcomes in future studies. Third, adjuvant therapies for both BrC and CRC were not unified because of the long-term study period. As the development of chemotherapeutics and diagnostic tools advances, it cannot be excluded since this may also affect certain outcomes. However, this study is crucial in analyzing the clinicopathologic characteristics and prognosis of double primary cancer patients who were diagnosed with both BrC and CRC.
In conclusion, in the metachronous double primary cancers of both BrC and CRC, the B-first group had a poorer prognosis than the C-first group. HER2 positivity and CRC LN metastasis can be considered prognostic factors for overall survival in these patients. These findings suggest that CRC screening program needs to be included during BrC surveillance. In addition, BrC patients need to pay more attention to CRC screenings in consideration of the poorer overall survival of the B-first group than the C-first group.