Proteomic identification of arginine-methylated proteins in colon cancer cells and comparison of messenger RNA expression between colorectal cancer and adjacent normal tissues
Article information

Abstract
Purpose
Identification of type I protein arginine methyltransferase (PRMT) substrates and their functional significance during tumorigenesis is becoming more important. The present study aimed to identify target substrates for type I PRMT using 2-dimensional (2D) gel electrophoresis (GE) and 2D Western blotting (WB).
Methods
Using immunoblot analysis, we compared the expression of type I PRMTs and endogenous levels of arginine methylation between the primary colorectal cancer (CRC) and adjacent noncancerous tissues paired from the same patient. To identify arginine-methylated proteins in HCT116 cells, we carried out 2D-GE and 2D-WB with a type I PRMT product-specific antibody (anti-dimethyl-arginine antibody, asymmetric [ASYM24]). Arginine-methylated protein spots were identified by mass spectrometry, and messenger RNA (mRNA) levels corresponding to the identified proteins were analyzed using National Center for Biotechnology Information (NCBI) microarray datasets between the primary CRC and noncancerous tissues.
Results
Type I PRMTs and methylarginine-containing proteins were highly maintained in CRC tissues compared to noncancerous tissues. We matched 142 spots using spot analysis software between a Coomassie blue (CBB)-stained 2D gel and 2D-WB, and we successfully identified 7 proteins that reacted with the ASYM24 antibody: CACYBP, GLOD4, MAPRE1, CCT7, TKT, CK8, and HSPA8. Among these proteins, the levels of 4 mRNAs including MAPRE1, CCT7, TKT, and HSPA8 in CRC tissues showed a statistically significant increase compared to noncancerous tissues from patients using the NCBI microarray datasets.
Conclusion
Our results indicate that the method shown here is useful in identifying arginine-methylated proteins, and significance of arginine modification in the proteins identified here should be further identified during CRC development.
INTRODUCTION
Colorectal cancer (CRC) is the 3rd most deadly and the 4th most commonly diagnosed cancer in the world [1]. The development and progression of CRC involve multiple different molecular mechanisms including mitogen-activated protein kinase cascades downstream of epidermal growth factor receptor, Notch, PI3K/AKT pathway, transforming growth factor-β, and Wnt/β-catenin signaling pathways [2]. In addition, mutations in various components of these signaling pathways have been linked to the development of CRC. Accordingly, there have been numerous efforts to target these signaling pathways to develop novel therapeutic approaches. However, as not all CRCs share similar driving mutations, it has been difficult to design a “catch-all” molecular therapy [3].
Protein arginine methylation is a common posttranslational modification that plays a critical role in a variety of intracellular events, such as DNA repair, signal transduction, protein-protein interaction, and transcriptional regulation [4, 5]. The reaction is catalyzed by a class of enzymes called protein arginine methyltransferases (PRMTs). PRMTs are classified into 2 major groups, type I and type II, according to their end products. Both type I and II enzymes can generate monomethyl arginine (MMA) as an intermediate. Type I enzymes (PRMT1, 2, 3, 4, 6, and 8) produce asymmetric NG,NG-dimethylarginine (ADMA), whereas type II enzymes (PRMT5 and 9) generate symmetric NG ,NG -dimethylarginine (SDMA) [4-6]. PRMT7 is a unique class III PRMT enzyme that only monomethylates arginine residue [7]. Recent studies have implicated protein arginine modification in the pathogenesis of various human diseases including cancer [8, 9], and PRMTs are emerging as potential therapeutic targets [10]. PRMT1 is significantly higher in colon cancer tissue compared with normal tissue, and it is associated with clinical and histological parameters such as nodal status and stage [11]. PRMT4/coactivator-associated arginine methyltransferase 1 is a positive modulator of WNT/β catenin-driven transcription and neoplastic transformation in CRC cells [12], and observations from clinical samples have shown that 75% of CRCs overexpress PRMT4 [13]. In our recent study, patients with PRMT6-positive CRC by immunohistochemistry had shorter disease-free survival than those with PRMT6-negative CRC in both univariate and multivariate analyses [14]. Consequently, identifying the location of methylarginine residues within PRMTs substrates and the functional significance of their modification during tumorigenesis is a critical issue.
The development of highly specific antibodies against MMA, ADMA, and SDMA in proteins has made it possible to enrich arginine-methylated peptides after trypsin digestion [15, 16]. Using immunoenrichment of arginine-methylated peptides combined with mass spectrometry (MS)-based proteomics technology, almost 10,000 arginine-methylated sites have been identified in various biological sources [16-19]. Using this approach, we identified 455 MMA sites in 272 proteins and 314 ADMA sites in 155 proteins from CRC tissues acquired from patients [20]. In addition, we identified 147 SDMA sites in 94 proteins, and quantitative analysis comparing CRC and normal tissues revealed a significant increase in the symmetric dimethylation of 70 arginine sites in 46 proteins and a decrease in that of 4 arginine sites in 4 proteins [21]. However, this approach requires large amount of protein (10 mg per 1 type of arginine modification). Besides, unlike phospho-specific antibodies, currently developed antibodies against methyl-arginine have their preferential antigen motifs such as a glycine-arginine-rich region [22]. Therefore, the immunoenrichment approach for identifying methyl-arginine sites in proteins is highly dependent on the antibody used.
In the present study, we compared endogenous levels of ADMA-containing proteins between CRC and matched normal tissues from patients using anti-dimethyl-arginine antibody, asymmetric (ASYM24) antibody which is a representative polyclonal antibody specific to ADMA [23] that is not used in immunoenrichment methods. Using 2-dimensional (2D) gel electrophoresis (GE) and 2D-Western blotting (WB) analysis with ASYM24 antibody followed by MS, we aimed to identify ADMA-containing proteins in HCT116 cells and compared the messenger RNA (mRNA) levels corresponding to the ADMA-containing proteins identified in HCT116 cells between CRC and noncancerous tissues from patients. We demonstrate that this approach is a useful tool for identifying methylarginine-containing proteins in clinical tissues as well as established cell lines.
METHODS
Tissue samples from patients with colorectal cancer
Patients diagnosed with primary CRC underwent radical surgery at the Samsung Medical Center in Seoul, Korea. We obtained prior patient consent as well as approval from the Institutional Review Board (No. 2017-05-065) to use clinical materials for research purposes. Eleven frozen CRC tumors and matched adjacent normal tissues were collected after surgery and the tissue samples were immediately frozen in liquid nitrogen. For protein extraction, 50–100 mg of tissue was homogenized using a TissueLyser (Qiagen, Hilden, Germany) in lysis buffer (7 M urea, 2 M thiourea, 4% [w/v] 3-[(3-cholamidopropyl) dimethyl-ammonio]-1-propanesulfonate [Merck, Darmstadt, Germany], 0.5% immobilized pH gradient buffer [GE Healthcare, Uppsala, Sweden], and 65-mM dithiothreitol [DTT], 1×protease and phosphatase inhibitors) and sonicated for 3 bursts of 30 seconds at 15 W. The extracts were then centrifuged at 20,000×g at 4°C for 15 minutes and the supernatant was stored at –80°C until use.
Cell culture, MS023 treatment, and protein extraction
Two human colon cancer cell lines, DLD1 and HCT116, were obtained from the American Type Culture Collection (Manassas, VA, USA). DLD1 and HCT116 cells were cultured in RPMI-1640 and McCoy’s 5A media, respectively. All culture media were supplemented with 10% fetal bovine serum and 1% penicillin/streptomycin (Gibco, Grand Island, NY, USA). Cells were maintained at 37°C with 5% CO2. Media were changed every 3 days. Cells were routinely subcultured when they reached 80% to 90% confluency. For MS023 treatment, both cell lines were seeded at a density of 1.0× 10⁶ cells in a 100-mm dish. After 24 hours incubation, cells were treated with increasing concentrations of MS023 as indicated in Fig. 1 for 48 hours. Cells were harvested in radioimmunoprecipitation assay lysis buffer supplemented with protease and phosphatase inhibitors. Lysates were briefly sonicated and centrifuged at 13,000 revolutions per minute (rpm) for 15 minutes. The supernatant was then stored at –80°C before use.
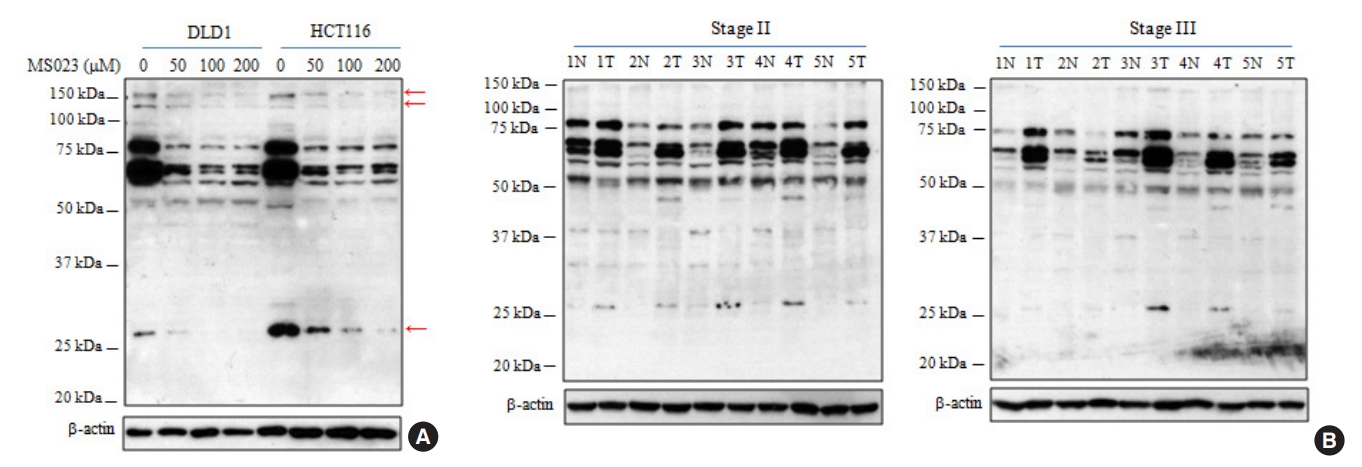
The patterns of asymmetric dimethylarginine (ADMA)-containing proteins in colorectal cancer (CRC) cell lines and tissues from patients. (A) The endogenous level of ADMA-containing proteins was analyzed by Western blot. (B) Using the same experimental conditions shown in Fig. 2, asymmetric arginine dimethylation status in CRC tissues was compared by Western blot.
To extract cellular proteins for 2D-GE, cells at about 90% confluence were washed twice with phosphate-buffered saline (PBS), scraped on ice in PBS, collected by centrifugation, and then lysed in the rehydration buffer mentioned above. The lysate was sonicated for 5 seconds at 60% amplitude, and insoluble material was pelleted by centrifugation at 13,000 rpm for 20 minutes. The supernatant was then stored at –80°C before use. Protein concentration was determined by the Bradford assay.
Two-dimensional electrophoresis and protein spot analysis
Isoelectric focusing (IEF) was carried out using IPG gel strips (pH 3–10 nonlinear, 13 cm; GE Healthcare, Uppsala, Sweden) on the Multiphor II system (GE Healthcare). Samples containing 200 μg of proteins were diluted with rehydration solution (GE Healthcare) to a final volume of 250 mL and applied to IPG tray followed by 15 hours of rehydration at 20°C. Proteins were focused for a total of 85,000 Vh. After IEF, the strips were equilibrated in equilibration buffer (50-mM Tris-HCl, pH 8.8, 6 M urea, 30% glycerol, 2% [w/v] sodium dodecyl sulfate [SDS], 20-mg/mL DTT, and 0.0125% bromophenol blue) for 15 minutes and then for an additional 15 minutes in the same solution except that DTT was replaced with 25 mg/mL iodoacetamide. SDS-polyacrylamide gel electrophoresis (PAGE) was used for the second separation in a Bio-Rad PROTEAN II xi gel system (Bio-Rad, Hercules, CA, USA). Total spot number and matching between the CBB-stained 2D gel and the immunoblot images were analyzed by PDQuest software (ver. 8.0, Bio-Rad).
Immunoblot analysis
The proteins resolved by 1-dimensional (1D) or 2D PAGE were transferred onto a PVDF membrane (Millipore, Billerica, MA, USA). The membranes were incubated overnight at 4°C with antibodies against PRMT1 (1:1,000 dilution, Cell Signaling Technology, Danvers, MA, USA), PRMT4 (1:5,000, Novus Biology, Centennial, CO, USA), PRMT6 (1:1,000 dilution, Cell Signaling Technology), ASYM24 (1:5,000, Millipore), and β-actin (1:10,000, Santa Cruz Biotechnology, Santa Cruz, CA, USA). After extensive washing with Tris-buffered saline (TBS), the immunoblot was incubated with peroxidase-conjugated secondary antibody for 1 hour at room temperature and then washed with TBS/0.05% Tween-20 followed by water. The bound antibodies were visualized by the immunoblotting detection reagents (Millipore). The relative intensities of specific signals were quantified using the Kodak MI imaging system (Kodak, Rochester, NY, USA).
Protein identification by mass spectrometry
MS analysis of protein samples was performed through a service provided by GENOMINE in Pohang, Korea (www.genomine.com). Spots of interest were manually excised, digested with trypsin (Promega, Madison, WI, USA), mixed with a-cyano-4-hydroxycinnamic acid in 50% acetonitrile/0.1% trifluoroacetic acid, and subjected to MALDI-TOF analysis (Ettan MALDI-TOF Pro, GE Healthcare) as described previously [24]. Spectra were collected from 300 shots per spectrum over an m/z range of 600–3,000 and calibrated with 2-point internal calibration using trypsin auto-digestion peaks (m/z5842.5099, 2211.1046). A peak list was generated using Flex Analysis 3.0 (Bruker, Billerica, MA, USA). The threshold used for peak picking was as follows: 500 for minimum resolution of monoisotopic mass and 5 for signal to noise. The search program MASCOT, developed by Matrixscience (http://www.matrixscience.com), was used for protein identification by peptide mass fingerprinting (PMF). The following parameters were used for the database search: trypsin as the cleaving enzyme, a maximum of one missed cleavage, iodoacetamide (cysteine) as a complete modification, oxidation (methionine) as a partial modification, monoisotopic masses, and a mass tolerance of ± 0.1 Da. PMF acceptance criteria were based on probability scoring.
In silico analysis of differential expression of mRNAs
The mRNA expression profiling data sets were obtained from the National Center for Biotechnology Information (NCBI) Gene Expression Omnibus (GEO) database portal (http://www.ncbi.nlm.nih.gov/geo/; accession numbers: GSE10950, GSE113513, GSE41258). Relative expression of mRNAs in the data sets was analyzed by comparing the values between CRC tumor and noncancerous tissues from patients.
RESULTS
Overexpression of type I protein arginine methyltransferases in colorectal cancer tissues relative to adjacent noncancerous tissues from patients
Based on previous reports [11-14], we compared the expression levels of 3 major type I PRMTs (PRMT1, PRMT4, and PRMT6) using Western immunoblots of CRC and adjacent noncancerous tissue extracts from the same patients with stage II and III. As shown in Fig. 2, PRMT1 and PRMT4 expressions increased in most tumor samples relative to the adjacent normal tissues, and these results were consistent with previous reports [11, 13]. In addition, we recently reported that PRMT6 expression increased by more than 1.5-fold in 35% of tumor samples relative to adjacent noncancerous tissues from the same patients [14]. The phenomenon was also reproduced in the present study (Fig. 2).
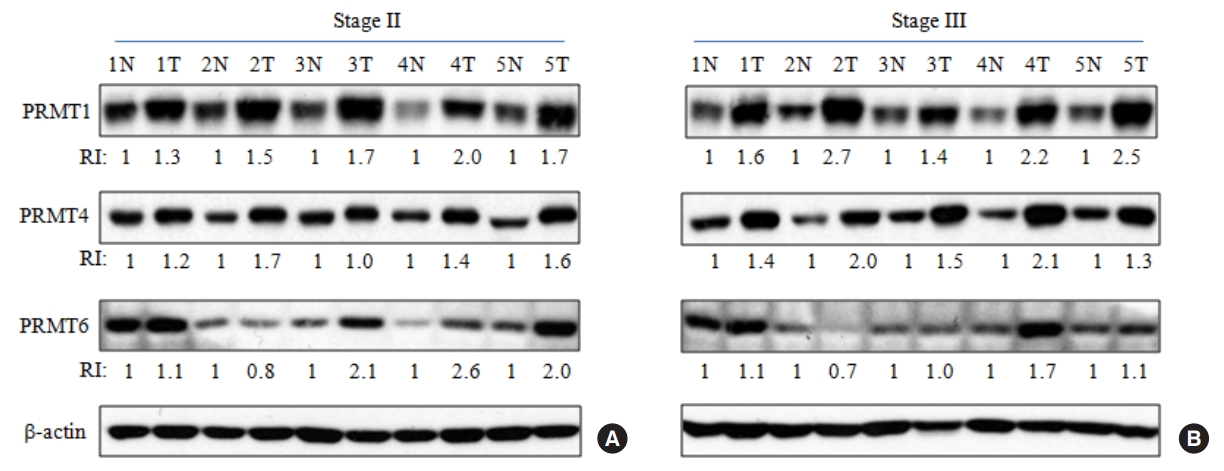
Increased expression of type I protein arginine methyltransferases (PRMTs) in colorectal cancer (CRC) tissues from patients. Tissue lysates (20 µg) from CRC and adjacent noncancerous tissues from patients were subjected to Western blot analysis with the respective type I PRMT antibodies was carried out using tissue lysates. Densitometric analysis of 3 major type I PRMTs expression was performed to compare the primary CRC (T) and adjacent noncancerous tissues (N) paired from the same patient with stage II (A) and III (B) CRC. RI, relative intensity.
Comparison of arginine methylation status between CRC and normal tissues from patients
Specific antibodies to detect protein-incorporated ADMA residue were successfully synthesized [16, 23]. ASYM24 is a representative antibody that we used in the present study [23]. Using the DLD1 and HCT116 cell lines derived from CRC, we further confirmed ASYM24 specificity using type I PRMT inhibitor. Eram et al. [25] have synthesized a highly specific inhibitor (MS023) of type I PRMTs and they showed that MS023 is completely inactive against type II PRMTs, protein lysine methyltransferases, and DNA methyltransferases [25]. DLD1 and HCT116 cells were treated with 3 increasing concentrations of MS023 for 48 hours. While ASYM24 signals at the 27-kDa and 150-kDa molecular masses showed an MS023 concentration-dependent decrease, those between 60 kDa and 90 kDa clearly decreased at the lowest concentration of MS023 in 2 CRC cell lines (Fig. 1A). These results strongly indicated that ASYM24 specifically reacts with protein-incorporated ADMA residues.
To compare the pattern of ADMA-containing proteins between clinical samples, we performed WB with ASYM24 antibody using 10 matched CRC and noncancerous tissues from patients. As shown in Fig. 1A, the pattern of ADMA-containing proteins in CRC tissues was generally similar to that of 2 CRC cell lines, suggesting that 2 biological sources share common substrates [20]. In addition, the levels of arginine modifications between 50 and 100 kDa are significantly elevated in most tumor samples relative to matched normal samples (Fig. 1B). This phenomenon might be due to overexpression of the 3 type I PRMTs as shown in Fig. 1B and/or their substrate proteins.
Identification of arginine-methylated proteins in HCT116 cells
Based on the similar pattern of ADMA between CRC cell lines and tissues (Fig. 1), we sought to identify individual ADMA-containing proteins using 2D-GE and immunodetection by WB with the ASYM24 antibody in HCT116 cells. Using HCT116 protein extract, 1D-IEF was performed as described in the Methods section followed by 2D-GE in duplicates. After 2D-GE, one gel was stained with CBB (Fig. 3B) and the other used for immunobloting with ASYM24 (Fig. 3B). There were 891 CBB-stained spots in the 2D gel and 242 2D-WB signals by ASYM24 antibody (Fig. 3C and Supplementary Fig. 1). The pattern of 2D-WB signals was generally correlated with that of 1D-WB. The major signals between 50 and 100 kDa that were detected by the ASYM24 antibody on 1D immunoblot (lane 5 in Fig. 1A) were also found in 2D-WB. In addition, the 27 kDa signal on 1D immunoblot of HCT116 cells was detected in the 2D-WB (spot No. 8005 in Fig. 3B).

Two-dimensional spot matching between Coomassie blue (CBB)-stained proteins in polyacrylamide gel and methyl-arginine signals on immunoblot. (A) One gel was stained with CBB. Blue outlines indicate protein spots corresponding to immuno-signals in the panel B. The protein spots used for identification by mass spectrometry are indicated by arrows and numbers. (B) The other gel was transferred to a PVDF membrane (Millipore, Billerica, MA, USA) followed by immunoblotting with the anti-dimethyl-arginine antibody, asymmetric antibody. Immunoblot signals that correlate to protein spots in panel A are indicated with green outlines. Arrows and numbers also indicate immuno-signals corresponding to protein spots in the panel A. (C) The total spot numbers of CBB-stained proteins and immunoblot signals as well as common spot numbers among the 2 images are shown as a Venn diagram. WB, Western blotting.
Using PDQuest software (ver. 8.0), we assigned the signals on 2D-WB to the CBB-stained proteins in the 2D polyacrylamide gel and 142 signals were matched (Fig. 3C). Among these spots, we selected 7 CBB-stained spots which showed relatively low protein staining intensity (spot No. 8005) to high intensity (spot No. 4405), as shown in Table 1. These spots were extracted from the CBB-stained gel and successfully identified by MS (Table 1). Among the identified substrates listed in Table 1, calcyclin-binding protein (CACYBP) [18], chaperonin containing T-complex protein 1 subunit 7 eta (CCT7) [17], heat shock cognate 71 kDa protein 8 (HSPA8) [17], cytokeratin 8 (CK8) [16], and transketolase (TKT) [18] proteins were previously reported as argininemethylated proteins. This indicates that the signals detected in 2D-WB are methyl-arginine specific, and this method can be a useful method to identify substrate proteins for PRMTs. In particular, although CACYBP showed the lowest CBB-staining intensity among the 7 proteins identified, its immunosignal by ASYM24 antibody showed the highest intensity (Table 1), suggesting that CACYBP might be a preferential target for type I PRMTs. However, microtubule-associated protein RP/EB family member 1 (MAPRE1) and glyoxalase domain-containing 4 (GLOD4) were identified as new targets for type I PRMTs in this study.

List of arginine-methylated proteins identified by mass spectrometry
Comparison of messenger RNA expression of the identified proteins by mass spectrometry between colorectal cancer and noncancerous tissues
Recently, we reported that CRC tissue maintains significantly higher level of symmetric arginine dimethylation compared to matched noncancerous tissue by quantitative analysis [21]. Among the proteins showing elevated symmetric arginine modification, several SDMA-containing proteins were overexpressed in CRC tissues relative to paired noncancerous tissues, indicating that elevated arginine methylation in CRC tissues was mainly due to overexpression of the substrate proteins [21]. Using 3 independent microarray datasets from the NCBI GEO database, we compared the mRNA expression of the 7 methyl-accepting proteins between CRC and adjacent normal tissues. Relative expression of GLOD4 and CK8 genes in the microarray datasets revealed no significant change between the 2 groups or down-regulation in CRC tissues relative to noncancerous tissues (Supplementary Fig. 2). However, MAPRE1, CCT7, TKT, and 2 splicing variants of HSPA8 (HSPA8 v1 and v2) mRNAs showed statistically significant increase in CRC tumor tissues compared to adjacent normal tissues in all microarray datasets (Fig. 4). While CACYBP mRNA level was also significantly up-regulated in CRC tumor tissues relative to noncancerous tissues in GSE113513 and GSE41258 data sets, it showed no significant change in GSE10950 data set (Supplementary Fig. 2). Therefore, we compared CACYBP level using tissue extracts as shown in Fig. 2 and found that the protein was highly expressed in CRC tissues compared with adjacent normal tissues (Supplementary Fig. 3).
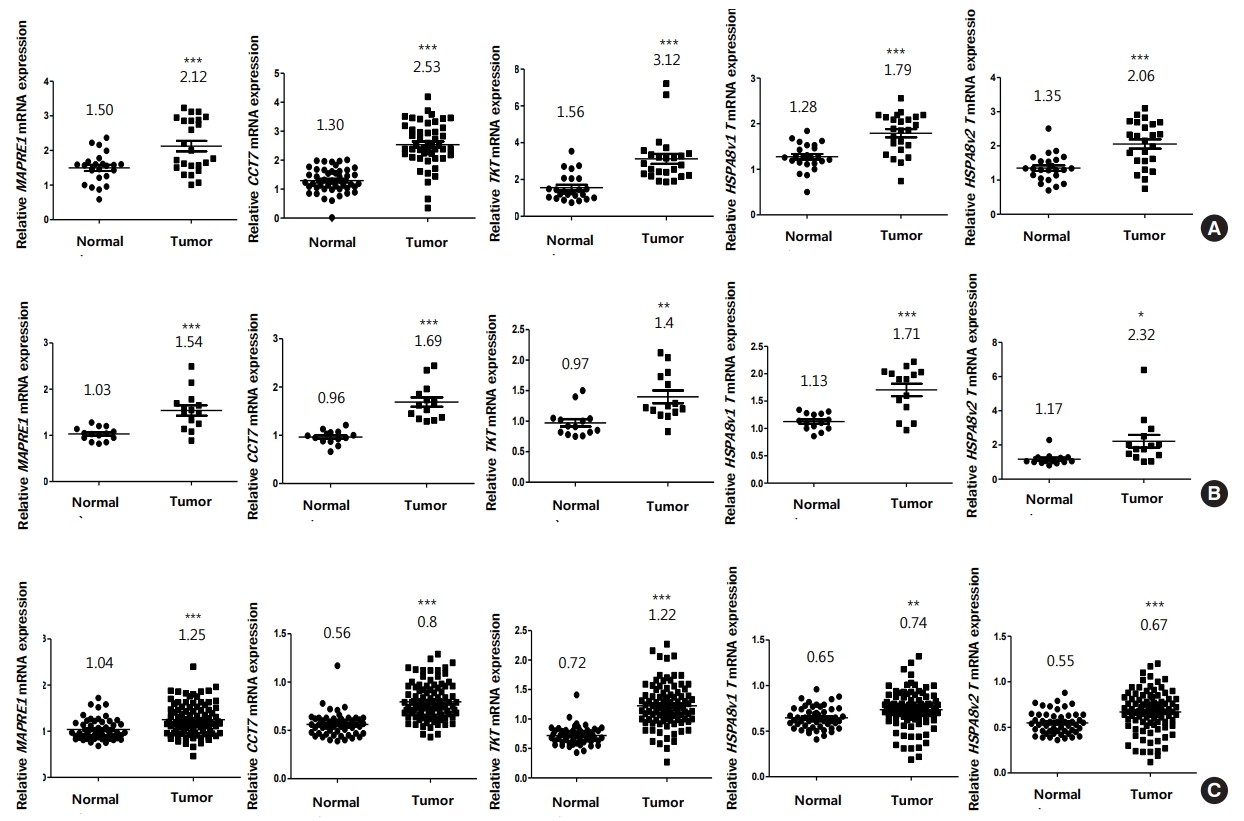
Overexpression of MAPRE1, CCT7, TKT, and HSPA8 messenger RNAs (mRNAs) in colorectal cancer (CRC) tissues compared to noncancerous tissues via in silico analysis. We analyzed the relative levels of each gene in the adjacent normal group (Normal) and CRC group (Tumor) using 3 independent sets of National Center for Biotechnology Information microarray data. The number of tissue samples for GSE10950 (A) and GSE113513 (B) data sets are 24 and 14, respectively. GSE41258 (C) data set contains 52 noncancerous and 96 CRC tissues. *P < 0.05, **P < 0.001, ***P < 0.0001.
A critical assumption in studying mRNA expression is that it is informative in the prediction of protein expression. However, the degree of correlation between mRNA and protein levels in various biological sources show weakly positive correlation, indicating differences in their regulatory mechanisms [26-28]. Therefore, it should be noted that expression of 7 proteins identified in this study must be further identified using immunohistochemistry between noncancerous and CRC tissues.
DISCUSSION
In the present study, we found that arginine methylation levels, as well as type I PRMTs, are highly maintained in CRC tissues compared to adjacent noncancerous tissues. These results strongly support that CRC tumors and adjacent noncancerous tissues are a good source for further identification and quantification of arginine methylation in proteins. Recently, we reported a number of MMA, ADMA, and SDMA sites in CRC tissues at the proteome level using immunoenrichment of arginine-methylated peptides combined with high-resolution liquid chromatography-MS/MS [20, 21]. There was a significant presence of methyl-arginine residues on nucleic acid binding proteins, protein complexes involved in transcription, and enzymes [21, 21]. Among the 7 proteins identified in the present study, HSPA8 and CCT7 were also identified as MMA-containing proteins in CRC tissues [20, 21]. HSPA8 is a chaperone protein that represents a constitutively expressed cognate protein of the HSP70 family. The arginine 469 residue (R469) of HSPA8 is highly conserved among HSP70 family members [29] and the residue is monomethylated by PRMT4 [30] and PRMT7 [29]. R469 monomethylation of the HSPA8 by PRMT7 contributes to the cytoprotective and stress responses [26]. CCT7 is a component of the CCT oligomer, which consists of 8 individual protein subunits, named either α to θ or 1 to 8 [31]. The CCT oligomer is majorly required for the folding of newly synthesized actin and tubulin molecules [32]. Among 8 members of the CCT complex, only CCT7 has RGG and GRG motifs on its N-terminal region, which are the preferential target motifs for PRMTs [16, 33]. However, the functional significance of arginine modification of CCT7 in protein folding during CRC tumorigenesis is unclear.
Larsen et al. [18] identified over 8,000 arginine monomethylation sites within 3,300 proteins in human embryonic kidney 293 cells using high-resolution MS and identified methylation of the R162 residue of CACYBP. Interestingly, CACYBP is a component of the ubiquitin pathway that associates with the Skp1-Cullin1-Fbox complex and is involved in the regulation of Siah-1-induced reduction in β-catenin protein level [34]. Interestingly, PRMT4, which was increased in CRCs compared with matched normal tissues (Fig. 2A), is a CACYBP-binding partner [35]. In this study, we found that CACYBP is highly methylated compared to its protein level in HCT116 cells (Table 1). Therefore, identification of catalytic enzyme for CACYBP methylation and the effect of arginine methylation of CACYBP on β-catenin stability should be further identified.
CK8 and TKT are known to contain multiple methyl-arginine sites [16, 18]. TKT is a rate-limiting enzyme in nonoxidative phase of the pentose phosphate pathway (PPP) [36] and 3 genes have been identified in the human genome encoding TKT isozymes: TKT, TKTL1, and TKTL2 [37]. In CRC, while Langbein et al. [38] reported that there was no difference in TKT mRNA expression between tumor and normal tissues from 54 patients, the mRNA expression retrieved from the Oncomine database showed significant increase in rectal and colon adenocarcinoma compared to noncancerous tissues [39]. In the present study, we also found that TKT mRNA level was significantly elevated in 3 microarray data sets (Fig. 4). The PPP is a very important metabolic pathway that connects with glycolysis and ribose-5-phosphate, and creates reduced nicotinamide adenine dinucleotide phosphate as a major product. Consequently, the PPP plays a pivotal role in helping glycolytic cancer cells to meet their anabolic demands and combat oxidative stress [40]. It is therefore interesting to investigate the effect of TKT arginine methylation on enzymatic activity or interaction with its substrates. CK8 is a member of type II (neutral-basic, CK1–CK8) gene family [41], and the epithelial cytoskeleton is predominantly formed by cytokeratins that are involved in maintaining cell morphology and protecting cells from mechanical and nonmechanical stressors [42]. In CRC, reduced expression of CK8 and CK20 has been associated with epithelial-to-mesenchymal cancer cell transition, which is generally indicative of higher tumor aggressiveness, and decreased patient survival [43]. In accordance with these reports, CK8 mRNA expression revealed significant down-regulation in GSE113513 and GSE41258 data sets (Supplementary Fig. 2).
GLOD4 and MAPRE1 have been identified as novel candidates for type I PRMTs. GLOD4 belongs to the glyoxalase I family and was firstly isolated from hepatocellular carcinoma in humans [44]. MARPE1 is a microtubule protein that binds to the tumor suppressor adenomatous polyposis coli (APC) [45]. While the expression pattern, molecular function, and its role during CRC tumorigenesis of GLOD4 have not yet been addressed, MARPE1 expression is increased in human CRC progression and both genetic and chemically induced models of CRC, consistent with a decrease in APC [46]. In addition, MARPE1 was suggested as a plasma biomarker for early-stage CRC and adenomas, when combined with other molecules such as carcinoembryonic antigen and adenylate kinase isoenzyme 1 [47]. Collectively, quantitative analysis of arginine modification among sera from patients with CRC and healthy donors may provide a new biomarker candidate for CRC.
Recent advances in MS methodology provide multiple choices to identify arginine-methylated proteins and specific modification sites. In addition, the development of highly specific antibodies against methylarginines in synthetic peptides has made it possible to enrich all types of arginine-methylated peptides, followed by high-resolution MS analysis. Using these technologies, thousands of arginine-methylated proteins from various biological sources were identified [17-21]. However, the methyl-specific antibodies used to enrich for arginine-methylated motifs could recognize a subset of substrates that would bias the motif description. In the present study, we showed that 2D-GE followed by WB with ASYM24 antibody could successfully identify new substrates for PRMTs in CRC cell line. This method might be useful for direct comparison of PRMTs’ substrate level in clinical samples as well as identification of methylarginine-containing proteins.
Notes
CONFLICT OF INTEREST
No potential conflict of interest relevant to this article was reported.
Acknowledgements
This research was supported by the National Research Foundation of Korea grant (NRF-2014R1A2A2A01004362) funded by the Korean government (MSIP) and by the Korean Society of Coloproctology Boryung Research Grant 2014.
SUPPLEMENTARY MATERIALS
Supplementary materials for this study are presented online (available at https://doi.org/10.3393/ac.2020.00899.0128).
Supplementary Fig. 1.
Spot detection and master gel assignment. The total number of Coomassie blue (CBB)-stained protein spots (A) and corresponding 2-dimensional Western blotting (2D-WB) signals (B) was analyzed by PDQuest software (Bio-Rad, Hercules, CA, USA). The CBB-stained gel was selected as the master gel (C) that was subsequently used for spot matching of 2D-WB image.
Supplementary Fig. 2.
Expression of CACYBP, GLOD4, and CK8 messenger RNAs (mRNAs) between colorectal cancer and noncancerous tissues. GSE10950 (A) and GSE113513 (B) and GSE41258 (C) data sets were used to analyze each mRNA level. *P<0.05, ***P<0.0001. NS, not significant.
Supplementary Fig. 3.
Increased expression of calcyclin-binding protein (CACYBP) in 10 colorectal cancer (CRC) tissues relative to adjacent normal tissues from patients. Densitometric analysis was carried out to compare the primary CRC (T) and adjacent normal tissues (N) paired from the same patient with stage II and III CRC. RI, relative intensity.