Are the width, length, depth, and area of submucosal invasion predictive of lymph node metastasis in pT1 colorectal cancer?
Article information

Abstract
Purpose
Submucosa-limited (pathological T1, pT1) colorectal cancers (CRCs) pose a continuing challenge in the choice of treatment options, which range from local excision to radical surgery. The aim of this study was to evaluate the morphometric and morphologic risk factors associated with regional lymph node metastasis (LNM) in pT1 CRC.
Methods
We performed a histological review of patients who underwent oncological resection between 2016 and 2022. Tumor grade, budding, poorly differentiated clusters (PDCs), cancer gland rupture, lymphovascular invasion (LVI), and presence of deep submucosal invasion (DSI), as well as width, length, total area, and area of DSI, were evaluated as potential risk factors for LNM.
Results
A total of 264 cases of colon and rectal carcinomas with invasion into the submucosal layer (pT1) were identified. LNM was found in 46 of the 264 cases (17.4%). All morphometric parameters, as well as DSI (P=0.330), showed no significant association with LNM. High grade adenocarcinoma (P=0.050), budding (P=0.056), and PDCs (P<0.001) were associated with LNM. In the multivariate analysis, LVI presence remained the only significant independent risk factor (odds ratio, 15.7; 95% confidence interval, 8.5–94.9; P<0.001).
Conclusion
The DSI of T1 CRC, as well as other morphometric parameters of submucosal tumor spread, held no predictive value in terms of LNM. LVI was the only independent risk factor of LNM.
INTRODUCTION
Colorectal cancer (CRC) screening programs and advances in medical imaging techniques for tumor staging have led to an increased proportion of patients with tumors limited to submucosal invasion. Additionally, the development of endoscopic technologies, such as transanal endoscopic microsurgery (TEM) and endoscopic submucosal dissection (ESD), has enabled the precise local excision of tumors with tumor-free resection margins (R0) in the vast majority of T1 tumors.
Local excision of T1 CRC carries minimal complications related to radical surgery. However, this type of surgery is essentially a tumorectomy without control of regional lymphatics, leading to a higher risk of recurrence. Evaluating the risk of lymph node (LN) involvement and selecting patients for salvage surgery are crucial tasks. A deep invasion of the tumor into the submucosal layer (sm3) is widely regarded in routine practice as one of the most meaningful predictors of LN metastasis (LNM).
According to the guidelines of the Japanese Society for Cancer of the Colon and Rectum (JSCCR), the European Association for Endoscopic Surgery (EAES), and the European Society of Gastrointestinal Endoscopy (ESGE), tumors with a depth of invasion greater than 1,000 µm have a high risk of metastasis [1–3]. This parameter is recommended to be measured either from the level of the mucosal muscularis propria or from the tumor surface when it cannot be determined due to the removal of the tumor within the submucosal layer. Additionally, the European guidelines recommend assessing the depth of submucosal invasion of T1 CRC using the Kikuchi classification for sessile and flat tumors or the Haggitt classification for pedunculated lesions [4–6]. Currently, exceeding the 1,000-µm threshold and sm3 classification are indications for radical surgery.
These recommendations stem from the idea that as tumor invasion into the submucosa deepens, the risk of regional LNM rises from 2% for T1sm1 to 20%–23% for T1sm3 [7–9]. This increase can be attributed to the expansion of lymphatic and vascular invasion. However, the relationship between the depth of carcinoma invasion and LN involvement has not been universally confirmed [10, 11].
Furthermore, the Kikuchi subclassification [4] and the Haggitt subclassification [5] of T1 CRCs can be applied only to surgical specimens obtained after full-thickness excision. As a result, they have limitations in assessing malignant colon polyps or tumors removed from within the submucosa due to the absence of microanatomical landmarks. Conversely, the so-called 1,000-µm rule is a contentious parameter because it lacks conventional measurement markers [12, 13]. In light of this, alternative morphometric parameters, such as the width and area of carcinoma invasion, have been suggested for evaluating tumor metastatic potential [14, 15].
In addition to submucosal tumor invasion, various histopathologic determinants of the aggressiveness of CRC are included in pathology reports. Among these factors, poorly differentiated tumor (grade 3), lymphovascular invasion (LVI), and a high tumor budding (Bd) score (grade 3) are associated with an increased risk of LNM [6, 16–18]. Notably, LVI is associated with the depth of submucosal invasion of the tumor, and the risk of regional LNM increases by 4 to 6 times when carcinoma penetrates through the bowel wall [7–9].
In addition to tumor differentiation, Bd is now recognized as a major histological manifestation of the epithelial-mesenchymal transition, which contributes to a higher metastatic potential of the tumor. In 2016, the International Tumor Budding Consensus Conference (ITBCC) standardized and validated the method for determining and calculating the Bd score, enabling its use in routine practice [19, 20].
A lesser-known characteristic, tumor aggressiveness, has been described by Ueno et al. [21] as poorly differentiated clusters (PDCs) consisting of 5 or more tumor cells that do not form glandular structures and are primarily located along the invasive edge of the tumor. Those authors reported that PDCs were a more significant indicator of the malignant potential of CRC than the degree of glandular differentiation. Similar to Bd, the presence and degree of PDCs can be considered a risk factor for LNM [21–23].
Another potential predictor of regional LNM in T1 CRC is the recently proposed histological indicator of cancer gland rupture (CGR). This is characterized by the focal or partial disappearance of neoplastic epithelial cells that form the cancer gland at the invasive tumor front. This histological feature has been suggested to enhance the identification of patients at high risk for LNM following endoscopic resection of early-stage CRC [24].
Notably, the prognostic value of proposed risk factors remains a matter of debate. Several studies have demonstrated the lack of prognostic value for the depth of submucosal invasion in T1 CRC, and conflicting data exist regarding the prognostic value of Bd. Further investigation of established tumor aggressiveness characteristics, as well as the identification of new ones, continues to be an important task [10, 18, 23]. This retrospective study was conducted to compare the quantitative morphometric parameters of tumors with qualitative risk factors.
METHODS
Ethics statement
This study was approved by the Ethical Review Committee of Ryzhikh National Medical Research Center of Coloproctology (No. 2022-07). Informed consent was waived due to the retrospective nature of the study. The study protocol adhered to the ethical guidelines outlined in the 1975 Declaration of Helsinki.
Patients
Data for patients who underwent surgery between 2016 and 2022 for histologically confirmed colorectal adenocarcinoma with invasion limited to the submucosal layer (pathological T1, pT1) were retrospectively collected from the archives of the Ryzhikh National Medical Research Center of Coloproctology (Moscow, Russia). The exclusion criteria included distant metastasis, as well as neoadjuvant chemotherapy and/or radiotherapy.
Sample preparation and analysis
The surgical specimens obtained via the resection of the large intestine containing the tumor were fixed in a 10% neutral formalin solution for 24 to 48 hours, followed by a thorough examination of the tumor in serial sections. Specimens obtained from ESD or TEM were spread out on a plastic plate and fixed in formalin solution for 12 to 24 hours. Tissue preparation was conducted in accordance with standard protocols and was performed using a tissue processor (ASP6025, Leica Microsystems) prior to embedding in paraffin blocks. Sections measuring 3 μm were taken and stained with hematoxylin-eosin.
Morphometric analyses were conducted on digital images of tumor sections, which were acquired using an Aperio T2 scanning microscope (Leica Microsystems) at ×20 magnification. A software package for digital image analysis (Aperio Imagescope ver. 12.4.0, Aperio Technologies) was utilized for this purpose.
Tumor morphometry was performed using the Imagescope ver. 12.4.0 software on selected digital images of the tumor sections exhibiting the most pronounced tumor invasion. The following parameters were measured in accordance with the method described by Toh et al. [14]: (1) the maximum width of the tumor, including carcinoma and adenoma components (Fig. 1); (2) the maximum width of adenocarcinoma within the tumor (Fig. 1); (3) the total area of adenocarcinoma, including intramucosal and submucosal components, in the sections displaying the most pronounced tumor invasion (Fig. 2); and (4) the length of the invasive adenocarcinoma front (Fig. 3).
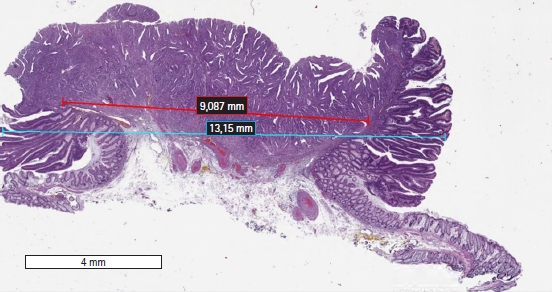
Digital slide showing the Imagescope (Aperio Imagescope ver. 12.4.0, Aperio Technologies) measurements (×20) of the maximum lesion width (blue bar) and carcinoma width (red bar).
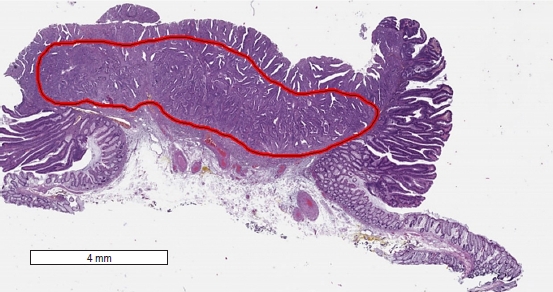
Digital slide showing the Imagescope (Aperio Imagescope ver. 12.4.0, Aperio Technologies) measurements (×20, contained within the red area) of the estimated maximum total (intramucosal and submucosal) area of carcinoma invasion (19.6 mm2).
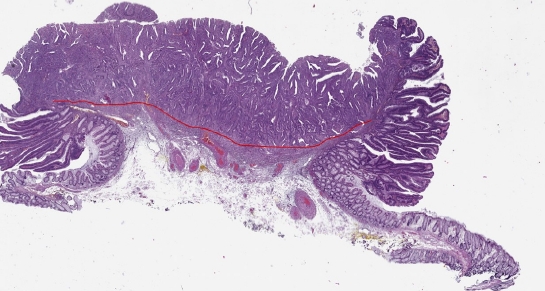
Digital slide showing the Imagescope (Aperio Imagescope ver. 12.4.0, Aperio Technologies) measurements (×20) of the maximum length of the invasive front (10.07 mm).
The Kikuchi classification [4] was utilized to assess the depth of invasion into the submucosal layer in nonpolypoid tumors. For pedunculated polypoid tumors, the Haggitt classification [5] was employed. Tumor differentiation grade was determined based on the World Health Organization (WHO) classification criteria for gastrointestinal tumors [25]. Tumor staging was conducted in accordance with the TNM classification [26].
Bd was defined in accordance with the ITBCC as a single tumor cell or a cluster of up to 4 tumor cells at the invasive margin of CRC [19]. The severity of Bd was assessed using the 3-stage JSCCR system [20]. Tumors were classified into 3 grades based on the number of PDCs observed under a ×20 objective lens in a 0.785 mm2 field in which they appeared most intensely (the hotspot method): low (Bd1), 0 to 4 buds; intermediate (Bd2), 5 to 9 buds; and high (Bd3), 10 or more buds.
PDCs were defined as cancer clusters in the stroma consisting of 5 or more cancer cells that had lost the ability to form gland-like structures. To count PDCs using the hotspot method, the area with the highest number of PDCs was first determined along the invasive edge of the tumor under a ×20 objective lens. PDC classification followed the system established by Ueno et al. [21]: tumors with fewer than 5 clusters were classified as grade 1, those with 5 to 9 clusters as grade 2, and those with 10 or more clusters as grade 3.
LVI was identified when tumor cells were found within the lumen of small vessels, confined by the endothelial layer [27].
To improve the detection of LVI, Bd, and PDC, selected tumor sections were additionally stained in accordance with the recommended protocols. This was done using a Ventana BenchMark Ultra immunohistochemical stainer (Roche Diagnostics) and a Ventana UltraView Universal DAB Detection Kit imaging system (Roche Diagnostics) along with antibodies to CK8/18 (clone B22.1 & B23.1, Roche Diagnostics) and CD31 (clone JC70, 1:100 dilution; Cell Marque).
Statistical analysis
The clinical and morphological characteristics of selected cases were entered into a database. To compare medians and means, the Mann-Whitney U-test and unpaired Student t-test were utilized, respectively. For categorical variables, the chi-square test was employed when there were more than 2 degrees of freedom, while the Fisher exact test was used for binary data.
In the univariate analysis, odds ratios (ORs) and 95% confidence intervals (CIs) were calculated for potential risk factors. For continuous values, receiver operating characteristic (ROC) analysis was used to determine the cutoff point and area under the curve (AUC). P-values of less than 0.05 were considered to indicate statistical significance. Significant risk factors were incorporated into a logistic regression analysis to identify independent predictors of LNM. Statistical analyses were performed using IBM SPSS ver. 22.0 (IBM Corp) and GraphPad Prism 6.0 (GraphPad Software).
RESULTS
A total of 264 cases of colon and rectal carcinomas with pT1 were selected from the institutional database. Among these, 24 patients underwent radical operations as salvage surgery within 4 to 6 weeks following local excision of the colonic tumor. Primary surgery included 11 ESDs and 1 polypectomy, or 12 TEMs for rectal lesions. The indications for salvage surgery were the presence of unfavorable prognostic factors (T1sm3 tumor, high-grade adenocarcinoma, LVI+, or R1 resection). Patient characteristics and surgical interventions are presented in Table 1.

Patient characteristics (n=264)
Of 264 surgical specimens, metastasis in regional LNs was identified in 46 cases (17.4%). The median number of harvested LNs was 20 (interquartile range, 14–30). Based on the number of affected LNs, the N category was determined as follows: N1a in 26 cases (9.8%), N1b in 14 cases (5.3%), N2a in 5 cases (1.9%), and N2b in 1 case (0.4%). Interestingly, no association was found between deep submucosal invasion (DSI) and lymphatic tumor involvement (OR, 1.2; 95% CI, 0.6–2.3; P=0.33) (Table 2).

Univariate analysis of categorical risk factors for lymph node involvement
High-grade adenocarcinoma was identified in only 9 cases (3.4%). Nearly half of the poorly differentiated tumors (44.4%) were accompanied by LNM (OR, 4.1; 95% CI, 1.0–15.7; P=0.05). PDC (P<0.001) was correlated with LNM, while a high grade of Bd demonstrated a strong tendency only (P=0.056). CGR was observed in most cases (33 of 49) involving metastasis to the LNs, although the obtained difference did not reach statistical significance (P=0.14).
The highest OR for LNM was detected for LVI (OR, 28.5; 95% CI, 8.5–94.9; P<0.001). In the multivariate analysis, LVI+ remained the only significant independent risk factor (OR, 15.7; 95% CI, 8.5–94.9; P<0.001). As a diagnostic test, LVI had a sensitivity of 0.93 (95% CI, 0.82–0.99), a specificity of 0.67 (95% CI, 0.60–0.73), a positive predictive value of 0.37 (95% CI, 0.28–0.47), and a negative predictive value of 0.98 (95% CI, 0.94–1.0). A comparison of morphometric characteristics between tumors with and without LNM, in terms of median lesion width, carcinoma width, invasive front length of carcinoma, and median carcinoma area, revealed no significant differences (Table 3).

Morphometric characteristics of tumors
The ROC analysis examining the association between morphometric characteristics and pT1 LNM revealed no predictive value for these tumor parameters (Fig. 4). The following cutoff points were assessed: ≤5.5 mm for the length of the invasive adenocarcinoma front (P=0.7), >8.5 mm for the width of adenocarcinoma in the tumor (P=0.6), >23.6 mm for the maximum width of the tumor (P=0.2), and >19.8 mm2 for the total area of the adenocarcinoma (P=0.4). No statistically significant association with LNM was found at these cutoff points.
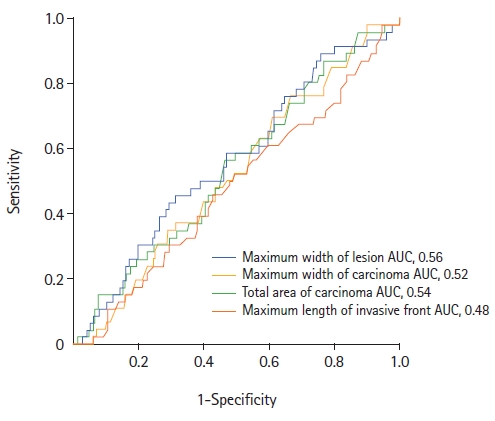
Receiver operating characteristic analysis of morphometric characteristics of tumors and lymph node metastases. AUC, area under the curve.
DISCUSSION
Local excision of T1 CRC using endoscopic methods offers organ-saving treatment and helps avoid many complications associated with radical surgery, particularly for rectal cancer. The main drawback of this approach is the inability to assess the status of regional LNs. Indications for salvage resection are based on a final pathological evaluation of several unfavorable tumor morphological features, allowing for the classification of tumors into high and low risk for regional LNM. Currently, the risk factors for LNM in T1 CRC included in treatment guidelines are deep tumor invasion into the submucosal layer (sm3, DSI ≥1,000 µm), high-grade adenocarcinoma, LVI, and a high degree of Bd (Bd2 and Bd3) [1–4, 28].
The depth of invasion is the most commonly used and recommended risk factor in current assessments. However, evaluating the DSI in locally excised CRC presents challenges for practical application due to the absence of a universally accepted measurement technique. This is particularly problematic for tumors removed within the submucosa (ESD), as at least 3 suggested methods exist for measuring DSI: from the tumor surface, from the lamina propria mucosae, and from the baseline when the lamina propria is entirely destroyed by the tumor. The results obtained can vary depending on the method used and the macroscopic type of tumor growth (exophytic, elevated, or depressed lesions) [11–13]. Additionally, the selection of a baseline can be highly complex and subjective.
In the 264 pT1 cases, metastasis of CRC to regional LNs was observed in 46 cases (17.4%), a frequency comparable to that reported in previous studies [6, 16, 18]. For DSI characterized as sm3 (or ≥1,000 µm), the rate of regional metastasis was 18.8%, which did not constitute a statistically significant difference from the 16.0% rate observed for sm1 and sm2 tumors (P=0.33). Our findings are consistent with several other studies demonstrating the lack of predictive value of submucosal invasion depth in relation to LNM for T1 CRC. A large meta-analysis by Ichimasa et al. [11] revealed that among all risk factors (DSI, high-grade adenocarcinoma, LVI, and Bd), the depth of submucosal invasion had the lowest prognostic value. Another meta-analysis [10] was unable to establish DSI as an independent risk factor for LNM. Eight studies, involving 1,146 patients, included in the meta-analysis, examined DSI as a standalone risk factor. The results showed that the absolute risk of LNM was 2.6%, and the pooled incidence rate was 2.83 (95% CI, 1.66–4.78).
The width of invasion and the area of submucosal invasion in carcinoma have been suggested as more objective and reproducible parameters for the histological examination of a locally removed T1 tumor [9, 14, 15]. It has been established that most lymphatic vessels are located in the upper third of the submucosal layer, and their density does not increase in the deeper parts of this layer [29, 30]. In line with this concept, the likelihood of vascular invasion and lymphatic metastasis is more likely determined by the length and area of the submucosal invasive front than by the depth of tumor invasion.
However, although the prognostic value of these parameters for LNM in T1 CRC has been demonstrated, significant variability has been observed in the determined cutoff points for the width and area of submucosal tumor invasion. This currently prevents the use of these parameters in practice [14–16].
In our study, the ROC analysis did not demonstrate prognostic value for the width, length, or area of tumor invasion, as the AUC was approximately 0.5 for each of these measurements. In the study group, histological indicators such as Bd and PDC demonstrated independent prognostic value as risk factors for LNM (P=0.05 and P<0.001, respectively). In contrast to a previous study conducted by our group [31], the prognostic value of these indicators was determined by the chi-square test regardless of their severity (Bd, grades 1–3; PDC, grades 1–3).
PDCs [21–23] exhibit a more pronounced association with LNM than Bd, demonstrating a statistically significant correlation with LNM regardless of the quantitative value (grade). In contrast, only a high degree of Bd (Bd2 and Bd3) is associated with an increased risk of LNM [20]. In this context, it seems reasonable to assume that PDCs better reflect the biological aggressiveness of the tumor than differentiation. The results obtained suggest that PDCs can serve as an additional or alternative indicator to Bd when the assessment of the latter is complicated.
The tumor differentiation grade has also shown a connection with LNM. Notably, however, the practical application of high-grade adenocarcinoma differentiation as a risk factor for LNM is limited due to its low occurrence in CRC [25] and the variability in its identification among pathologists [11, 21, 32–34].
In the present study, we sought to clarify the role of CGR as a potential risk factor for LNM in T1 CRC. CGR was about twice as common in the group with LNM than in the group without it; however, similar to our previous study [31], we were unable to demonstrate a statistically significant association with LNM in the univariate analysis (P=0.14).
The study also confirmed that LVI is the most significant risk factor for metastasis to regional LNs in the univariate analysis, with an OR of 28.5 (95% CI, 8.5–94.9; P<0.001). In the logistic regression model, LVI remained the only independent risk factor for metastasis to regional LNs (P<0.001). In this study, the high sensitivity (93%) and moderate specificity (67%) of LVI, in addition to the high negative predictive value of 98%, allow for the interpretation of T1 tumors without LVI as tumors with a very low risk of LNM.
The assessment of LVI presents considerable variability among pathologists, as evidenced by studies showing low κ coefficient values ranging from 0.16 to 0.44, indicating low interobserver agreement. However, some research has demonstrated that employing immunohistochemical staining with D2-40 can lead to more precise detection of LVI and an increased κ coefficient of up to 0.56 [18, 32, 35].
In summary, the results of our study indicate that LVI, Bd, PDCs, and poorly differentiated tumor are the most significant predictors of LNM in T1 CRC. This finding aligns with data from numerous other studies, which have demonstrated that tumor morphological characteristics hold superior predictive value compared to submucosal layer invasion. The role of DSI as an independent predictor of LNM has been reevaluated, although it remains one of the most frequently cited risk factors in current guidelines. Clearly, tumor morphology (grade differentiation, LVI, Bd, and PDCs) is a more reliable predictor of LNM than morphometry. However, research and meta-analyses of the primary LNM predictors in T1 CRC have shown that none of the currently used morphological indicators can be employed independently, as they lack sufficient sensitivity and specificity [10, 11, 16, 18, 20, 32].
The primary limitations of our study include its single-center design and relatively small group of patients with T1 CRC, which included only 46 cases (18.5%) with LNM. The tumor morphometry incorporated parameters such as the width of the adenocarcinoma, the length of the invasive front, and the total area of the adenocarcinoma. These measurements were conducted in accordance with previously proposed methods [13, 21, 24]. However, all assessments were performed by a single pathologist who was not blinded to the tumor stage and LNM status, which could potentially introduce bias. Undoubtedly, a larger study is necessary to validate the results obtained. Nevertheless, given that the vast majority of previous publications have originated from Japan and Korea, the present study contributes to the diversity of patient populations.
The results of the presented study indicate that DSI invasion of T1 CRC, as well as other morphometric parameters of submucosal tumor spread, lack predictive value in terms of LNM. Low differentiation of adenocarcinoma, Bd, PDCs, and LVI are significant risk factors for LNM in T1 CRC. Among these, LVI was the only independent risk factor. To reach a definitive conclusion, a study with a larger number of cases, a multicenter design, and multiple blinded pathologists is necessary.
Notes
Conflict of interest
No potential conflict of interest relevant to this article was reported.
Funding
None.
Author contributions
Conceptualization: all authors; Data curation: SC; Formal analysis: EK, ER; Investigation: OM; Resources: OM; Writing–original draft: OM, ER; Writing–review & editing: all authors. All authors read and approved the final manuscript.