




INTRODUCTION
Currently, colonoscopy is used as a screening test for colorectal cancer, as well as a tool for diagnosing and treating other colorectal diseases. Although this technique is considered safe, complications following colonoscopy cannot be overlooked. Studies have reported that colonoscopy can cause minor complications in up to 33% of the patients, and serious complications in 0.28% [1,2]. However, complications of rhabdomyolysis following colonoscopy resulting in death have rarely been reported. Therefore, we report here a case of 1 patient who died from rhabdomyolysis-related complications after colonoscopy.
CASE REPORT
A 60-year-old man with acute left lower abdominal pain and left thigh pain was admitted 1 day after an ‘uncomplicated’ colonoscopic polypectomy. He had undergone an endoscopic mucosal resection (EMR) to remove a 0.8-cm-sized, protruding, sessile polyp in the distal descending colon. Approximately 10 hours following that procedure, the patient complained of increasing left abdominal pain. He did not have any underlying diseases except chronic alcoholism.
Initially, his body temperature, blood pressure, and pulse were 37.8℃, 120/80 mmHg, and 118 beats/min, respectively. His blood test showed a white blood cell (WBC) count of 18,300/µL, with a left shift (neutrophils, 91.7%). He showed direct and rebound tenderness on the left lower abdomen. His left thigh pain worsened when he extended his leg. He was administered intravenous (IV) antibiotics, ceftizoxime 1 g and metronidazole 500 mg, and IV crystalloid fluid at a rate of 2,400 mL/hr. After 2 hours, the WBC count had increased to 29,400/µL, and his left lower abdominal pain had intensified, with severe direct and rebound tenderness.
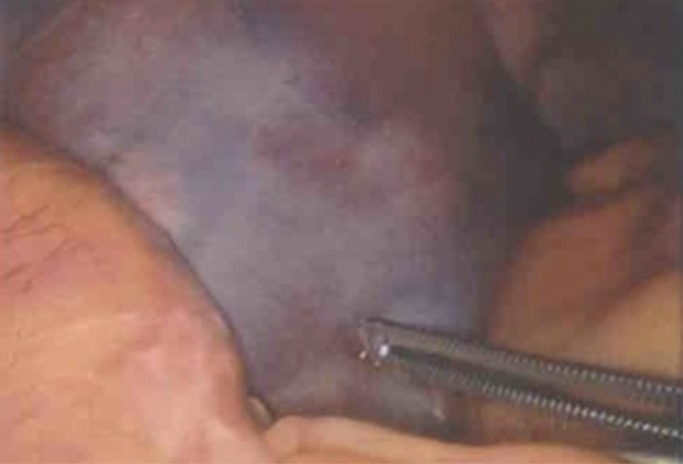
A computed tomography (CT) scan showed extraluminal free air bubbles around the sigmoid and the descending (SD) colon junction, minimal pericolic infiltration, and a high air density along the left psoas muscle. However, a definite abscess cavity was not seen (Fig. 1A, B). From these results, we suspected a secondary peritonitis due to colonic perforation after colonoscopy, so we performed a laparoscopic exploration. During the exploration, we mobilized the SD colon in the retroperitoneum and found small-sized ecchymoses on the SD colon junction, but no obvious macroscopic perforation or injury of colon was noted. Moreover, a severe bruise was observed in the retroperitoneum near the left psoas muscle. We explored the bruising site, but found no abscess, phlegmon, or necrotic tissue (Fig. 2).
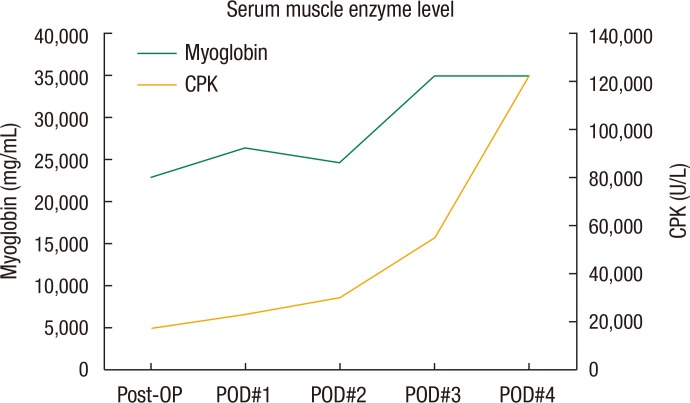
Eight hours after the operation, the patient passed a large amount of dark red urine (myoglobulinuria) followed by oliguria (0.45 mL/kg/hr). The serum creatinine level had increased from 2.3 to 3.4 mg/dL. After examining the serum myoglobulin level (Fig. 3), we diagnosed the condition to be rhabdomyolysis. The patient was transferred to the intensive care unit, and continuous renal replacement therapy was started for rhabdomyolysis-induced acute renal failure.
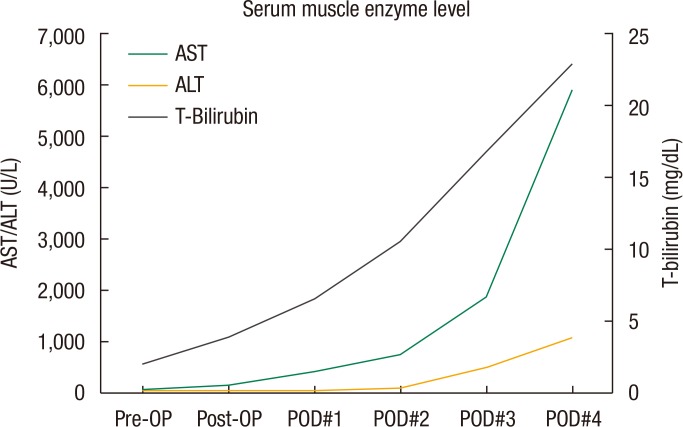
Despite acute renal failure, the patient was alert, and his vital signs were stable until the third postoperative day when his systolic blood pressure (SBP) decreased to 70 mmHg, at which time norepinephrine IV infusion was started. However, it was soon tapered and stopped because the SBP had stabilized by the fifth postoperative day. Additionally, the bilirubin levels were also rising, and jaundice and acute liver failure had developed. On the fourth postoperative day, the total bilirubin level had increased to 22.9 mg/dL, and the aspartate aminotransferase/alanine aminotransferase levels had increased to 5,890/1,092 U/L (Fig. 4). Thereafter, he lapsed into a drowsy mental state. He became hemodynamically unstable, and his respiratory function clearly decreased on the eighth postoperative day. Finally, on the tenth postoperative day, the patient expired due to multiple organ failure.
This case report was approved by the Institutional Review Board.
DISCUSSION
Recently, colonoscopy has become indispensable in the diagnosis and treatment of patients with many colorectal diseases. Though procedures related to colonoscopy are considered safe, many complications from minor symptoms such as abdominal discomfort, diarrhea, constipation, flatulence, fecal incontinence, or fecal urgency to more serious symptoms such as colonic perforation, bleeding, and cardiopulmonary arrest related to conscious sedation have been reported. Over 85% of the serious colonoscopy complications have been reported to occur in patients undergoing a colonoscopic polypectomy [1]. Among the serious complications, colonoscopy-related rhabdomyolysis resulting in death has rarely been reported. Rhabdomyolysis is a condition in which a damaged skeletal muscle breaks down rapidly, and the breakdown products are released into the bloodstream. Some of those products, such as the protein myoglobin, are harmful to the kidneys and may lead to acute renal failure.
Different etiologies contributing to rhabdomyolysis have been reported in several studies involving large series of hospitalized patients [3,4]. In a study that included 2,371 patients with rhabdomyolysis, the most frequently associated clinical conditions were trauma (26%), immobilization (18%), sepsis (10%), and having undergone vascular surgery (8%) and cardiac surgery (6%) [3]. In another series of 475 patients, the most common causes reported were consumption of exogenous toxins (46%), including alcohol and illicit drugs (34%), and prescription drugs (11%) [4]. However, up to 60% of the patients had more than one etiologic factor.
Rhabdomyolysis is characterized clinically by myalgias, red to brown urine due to myoglobinuria, and elevated serum muscle enzymes (including creatine phosphokinase) [5]. The degree of muscle pain and other symptoms varies widely. For the prevention and management of acute renal failure due to rhabdomyolysis, massive IV hydration, urine alkalization, and close follow-up for urine output and blood creatinine level are needed. In the case of compartment syndrome, a fasciotomy could be performed after precise diagnosis using magnetic resonance imaging, CT, or ultrasonography [6].
Many reports of patients in which colonoscopy-related rhabdomyolysis was treated have been published. Son et al. [7] and Choi et al. [8] reviewed several cases where hyponatremia with rhabdomyolysis was reported after bowel preparation. In all those cases, sodium phosphate, instead of polyethylene glycol, was used to evacuate the colon. However, in our case, the patient did not show any electrical imbalance, though an osmotic agent composed of anhydrous sodium sulfate, potassium sulfate, and anhydrous magnesium sulfate had been used. Gigante et al. [9] reported rhabdomyolysis after midazolam administration in a cirrhotic patient treated with atorvastatin. In addition, in a number of cases, statin-induced myopathy has been reported. Therefore, in cases where the patients are prescribed statins, special care should be taken during their colonoscopic procedure. In a case report by Casserly et al. [10], a patient experienced propofol infusion syndrome, which is characterized by unexplained myocardial failure, metabolic acidosis, and rhabdomyolysis with renal failure. In our case, the patient was also given midazolam (3 mg) and propofol (3 mg). However, we could not ascertain an association between the midazolam/propofol administered and rhabdomyolysis because we did not check the midazolam/propofol levels.
In our patient, determining the most probable cause of rhabdomyolysis was not easy because of discordances between the patient's medical findings. He underwent EMR and his CT image showed free gas, but his operative findings revealed no macroscopic perforation or abscess formation. In addition, the colonoscopic EMR was uncomplicated and was performed with submucosal saline injection. The polyp size was also small. However, a hot biopsy was done, and no prophylactic endoscopic clips were used [11]. Hence, colonic ‘microscopic’ perforations were more likely to have occurred than macroscopic perforations. Therefore, we assumed that the colonoscopic EMR or mechanical injury could have contributed to the microscopic colonic perforation and bacterial infection, which might have been possible causes of rhabdomyolysis. However, sepsis was not preexisting initially, with the blood/body fluid cultures revealing no bacterial growth, and the bowel preparation level was fair. The other possible causes of rhabdomyolysis could be the patient's alcohol abuse, the use of midazolam/propofol, and an electrical burn to a muscle.
The incidence of colonic perforation ranges from 0.016% to 0.2% following diagnostic colonoscopies and could go up to 5% following some colonoscopic interventions. Perforations are frequently related to therapeutic colonoscopies and are associated with patients of advanced age or with multiple comorbidities [12]. The most frequent site of mechanically induced perforation is the intraperitoneal sigmoid colon because of its frequent redundancy, its narrowing due to diverticular disease, and the presence of adhesions from previous pelvic operations.
Two case reports on patients with retroperitoneal gas gangrene after a colonoscopic polypectomy without bowel perforation have been reported [13,14]. The clinical symptoms and CT findings were similar to those in our case. However, the autopsy showed a massive gas gangrene of the retroperitoneum caused by Clostridium perfringens without rhabdomyolysis. Therefore, gas gangrene should be considered as a differential diagnosis, especially after a polypectomy and especially when the gas involves the muscles of the belly.
In summary, although colonoscopy is generally considered safe, endoscopists should pay attention to colonoscopy-related complications because it is an invasive procedure, and severe complications may occur in preparation procedure, during, and after it. Rhabdomyolysis caused by bowel preparation or drug use has been reported in the literature, but not rhabdomyolysis caused by the colonoscopy itself. We report here a case of rhabdomyolysis as a severe complication after colonoscopy. Therefore, we recommend that rhabdomyolysis be added to the list of complications following a colonoscopic procedure. Also, for the prevention and early treatment of rhabdomyolysis, endoscopists should be attentive to its risk factors and signs/symptoms.


 PDF Links
 PubReader
 ePub Link
 XML Download
 Full text via DOI
 Full text via PMC