


INTRODUCTION
Preoperative chemoradiotherapy (CRT) or radiotherapy has been the standard treatment for patients with advanced rectal cancer and reduces by about 50% the local recurrences in such patients compared to those who underwent surgery alone [1-4]. Preoperative CRT shrinks rectal cancers, and the degree of tumor response to radiotherapy relates to patientsŌĆÖ oncologic outcomes [5, 6], with patients with a higher pathologic tumor regression grade showing a higher disease-free survival. In the pooled analysis of 3,105 patients, the disease-free survival and the overall survival were higher, and the rates of local recurrence and distant metastasis were lower in patients with a pathologic complete response (pCR) than in those with residual tumors [7].
Shrinkage of the tumor and downstaging of the tumor are associated with the time from the completion of preoperative CRT to surgery [8-14]. To some point, CRT can shrink rectal cancer, but after some time point, the residual tumor regrows and results in tumor progression, except in 10%ŌĆō20% of patients with a pCR. Several studies on the time intervals between preoperative CRT and surgery have been done, but the optimal time interval has not been established yet.
In 1999, the Lyon trial was a pivotal study in the current practice of 6- to 8-week intervals between preoperative CRT and surgery [8]. In that study, patients with a 0- to 2-week interval and those with a 6- to 8-week interval between preoperative CRT and surgery were compared. The longer interval group demonstrated a smaller pathologic remnant tumor and earlier tumor and nodal staging than the shorter interval group, but with no significant difference in long-term survival. That study compared only 2 groups, and the optimal time could not be defined. A nationwide cohort study from the Netherlands reported that the pCR rate and N downstaging were highest at 15 to 16 weeks from the initiation of radiotherapy, but the authors only reported pathologic outcomes without survival outcomes [14]. References about when to operate after preoperative radiotherapy in patients with locally advanced rectal cancers are lacking because previous studies have reported conflicting results, and most were retrospective studies performed at a single center [15-17]. Therefore, this study aimed to evaluate the effect of the time interval between completion of preoperative CRT and total mesorectal excision for patients with rectal cancer on the pathologic tumor response and patientŌĆÖs survival by using data from a nationwide cohort database.
METHODS
Data source
This was a retrospective cohort study of the national database of the Health Insurance Review and Assessment Service (HIRA), South Korea. Since 2011, the HIRA has collected perioperative outcomes of patients with colorectal cancers to audit the standardized diagnosis and management and to improve the quality of treatment. The evaluation is conducted annually for all medical institutions in South Korea that treat patients with colorectal cancer. In the hospitals that have more than 100 new patients a year, 100 patients from each institution are randomly selected for the HIRA assessment whereas in the hospitals that have less than 100 patients per year, records of all patients are evaluated. The results of the quality assessment are given to each hospital and should be used to improve the quality of patientŌĆÖs care. The items on the quality assessment are listed in Table 1. Colorectal cancer was coded as C18 (colon cancer), C19 (rectosigmoid colon cancer), or C20 (rectal cancer). Patients aged >18 years with primary colorectal cancer and those with synchronous colorectal cancer were included in the quality assessment. Patients with distant metastasis, other organ malignancies, and carcinomas in situ were excluded. This study was exempted from approval and informed consent from Institutional Review Board of National Cancer Center.
Patient selection
We selected patients from the HIRA database who had been diagnosed as having rectal cancer (C20) and had received preoperative long-course radiotherapy and then underwent surgery. Since 2012, the dates of radiotherapy and surgery have not been collected in the HIRA database; thus, only patients who underwent surgery between May 2011 and December 2011 were included in this study. The codes of the operations were QA921, Q2927, QA922, QA293, and QA924, which included anterior resection, low anterior resection with or without colonic pouch formation, abdominoperineal resection, and all operations such as a lymphadenectomy, respectively. We included cT2-4NxM0 stage cancers and histology with an adenocarcinoma or a mucinous adenocarcinoma. Patients with short-course preoperative radiotherapy, a history of colectomy, and lack of medical record information were excluded from this analysis.
Variables and definitions
Collected data included patient demographic characteristics, clinical and pathologic stages of the tumor, tumor location, treatment regimen, duration and completion date of neoadjuvant CRT, type of surgical procedure, completeness of the resection, and postoperative pathologic data. Patients were divided into 4 groups according to the time interval between the completion of preoperative radiotherapy and surgery: 5ŌĆō7 weeks (35ŌĆō48 days), 7ŌĆō9 weeks (49ŌĆō62 days), 9ŌĆō11 weeks (63ŌĆō6 days), and >11 weeks (>77 days). The primary outcome was the rate of pCR (ypT0N0), and secondary outcomes were tumor downstaging (ypT<cT), node downstaging (ypN<cN), TN downstaging (ypTN<cTN), and 3-year overall survival. Patients with ypT0-1 were defined as good responders to preoperative CRT. Overall survival was based on death due to any cause.
Statistical analyses
The chi-square test and the Fisher exact test were used for 4 group comparisons of categorical variables, as appropriate, and a 1-way analysis of variance was used for 4 group comparisons of continuous variables. The Kaplan-Meier method was used to estimate overall survival, and survival curves were compared among the four groups by using the log-rank test. A P-value <0.05 was considered statistically significant, and all statistical analyses were performed using SAS 9.3 (SAS Institute Inc., Cary, NC, USA).
RESULTS
Data of 1,920 patients who underwent operation for rectal cancer between May 2011 and December 2011 were collected from the HIRA database. We excluded 1,278 patients (66.6%) because they did not receive preoperative or postoperative radiotherapy (Fig. 1). Preoperative radiotherapy was performed in 436 of 642 (67.9%) patients. Additional patients were excluded from the analysis for the following reasons: (1) a lack of pathologic records (n = 178), (2) incomplete radiotherapy (n = 1), (3) operation after 560 days from the completion of radiotherapy (n = 1), and (4) an interval <4 weeks between the completion of radiotherapy and operation. Finally, 249 patients were included in the analysis.
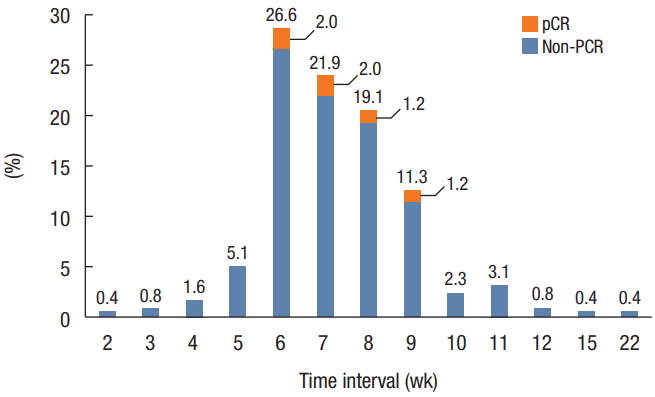
The distribution of patients according to the time intervals between preoperative radiotherapy and operation is demonstrated in Fig. 2. Patients were classified into 4 groups based on the time interval between preoperative radiotherapy and operation: 5ŌĆō7 weeks (n = 86), 7ŌĆō9 weeks (n = 113), 9ŌĆō11 weeks (n = 38), and >11 weeks (n = 12). The overall pCR rate was 16 of 249 (6.4%), and pCR was only observed in patients with an interval of 6ŌĆō9 weeks. The baseline characteristics, sex, body mass index, and American Society of Anesthesiology physical status classification were not significantly different among the 4 groups (Table 2). The mean age was greater and incidence of a history of abdominal operation was higher in the >11-week interval group than in the other groups.
Pretreatment clinical stages are listed in Table 3. The cT classification, cN classification, and cTN classification were similar among the four groups (P = 0.19, P = 0.15, and P = 0.23, respectively). Most patients in all the groups had tumors of cT3 classification (5- to 7-week interval, 76.7%; 7- to 9-week interval, 77.9%; 9- to 11-week interval, 57.9%; and >11-week interval, 66.7%) and IIIb stage (5- to 7-week interval, 62.8%; 7- to 9-week interval, 63.7%; 9- to 11-week interval, 44.7%; and >11-week interval, 41.7%).
Postoperative outcomes are shown in Table 4. The median length of hospital stay was 13ŌĆō14.5 days, and the difference was not significantly different among the 4 groups (P = 0.23). The numbers of harvested lymph nodes and tumor differentiation were similar among the groups according to the time interval between preoperative radiotherapy and operation. pCR rates were 6.2%, 7.6%, 8.6%, and 0% in the 5- to 7-week interval, 7- to 9-week interval, 9- to 11-week interval, and >11-week interval groups, respectively (P = 0.89). T downstaging, N downstaging, and TN downstaging were observed in 34.9%, 55.8%, and 57.4% of all patients, respectively, and T and N downstaging were not significantly different among the 4 groups. TN downstaging was observed in 64.5%, 69.2%, 52.9%, and 36.4% of patients in the 5- to 7-week interval, 7- to 9-week interval, 9- to 11-week interval, and >11-week interval groups, respectively (P = 0.09).
The median follow-up time was 39.7 ┬▒ 7.9 months. Three-year overall survival rates were 93.0%, 85.0%, 81.6%, and 91.7% in the 5- to 7-week interval, 7- to 9-week interval, 9- to 11-week interval, and >11-week interval groups, respectively (P = 0.33) (Fig. 3).
DISCUSSION
In this study, by using the HIRA database, we failed to define optimal timing for downstaging or pCR in patients with rectal cancer after preoperative CRT. The proportion of patients with TN downstaging was the highest in the 9- to 11-week interval, but this difference was not statistically significant. We could also not find a significant difference in the overall survival of patients according to the time interval between preoperative radiotherapy and surgery.
We used the nationwide HIRA database, which is used to evaluate the quality of treatment of patients with colorectal cancers. Comparing the time interval between preoperative radiotherapy and surgery at a single institution retrospectively would have been difficult because most patients undergo surgery within similar intervals according to surgeonsŌĆÖ preferences; however, in this nationwide study, we were able to collect data on a large number of patients with wide variations in that interval. Contrary to our expectation, since 2012, data on the quality control of the treatment of patients with colorectal cancers were collected without the dates of surgery and CRT so as to reduce the labor involved in data collection. Therefore, we could collect only data from the last half of 2011, which was the year in which quality control was evaluated nationally.
Many researchers have tried in prospective and several retrospective studies to identify the optimal time interval between preoperative radiotherapy and surgery to increase pCR rates and decrease operative morbidities, but the results have been conflicting and inconsistent [9-11, 15-21]. To the best of our knowledge, only 2 prospective studies have been performed on the time interval [8, 17]. Recently, a prospective clinical trial reported that waiting 11 weeks after CRT did not increase the rate of pCR after surgical resection [17]. Similar trends were also observed in the present study in that TN downstaging was most prominent in the 7- to 9-week interval group, and the downstaging rate decreased for longer intervals, although the differences were not statistically significant. With increasing preferences for the nonoperative management of patients with rectal cancers, presumptions exist that long intervals will increase the tumor response rate to CRT, but the results indicate that longer intervals do not convert nonresponders to good responders.
This study has several limitations. First, we designed the study to analyze the time intervals as continuous variables and to identify the optimal interval for increasing the pCR rate; however, we were unable to define the optimal interval due to a lack of data. If the HIRA database is to be used in future studies, more information, such as the dates of surgery and radiotherapy, is necessary. The number of patients was much smaller than we expected before initiating the study because the HIRA extracted 100 patients selectively from each institution and did not enroll all patients with rectal cancer, which made conducting statistical analyses with meaningful power and drawing definitive conclusions more difficult. Lastly, this database was set up only a few years ago; therefore, the present study had a follow-up period <4 years. Given that late recurrence is common in patients with rectal cancer treated with radiotherapy, this follow-up period might not be sufficient for evaluating oncologic outcomes, including the survival rate. In conclusion, delaying surgery by 9 to 11 weeks may increase TN downstaging, but delaying it for longer than 11 weeks may not lead to additional tumor downstaging from long-course CRT.