


INTRODUCTION
Hemorrhoidal disease (HD) results from the distal displacement of the anal cushions. The estimated prevalence of HD varies widely among several studies, with numbers from 4.4% to 40% being quoted [1]. The prevalence is higher among the Caucasian population, and the peak incidence tends to occur between the ages of 45 and 65 years [1-3]. The development of HD occurs when vascular, inflammatory and mechanical factors interact in a pathological way not fully understood so far [2-4]. Several risk factors for the development of HD are described. Constipation is frequently associated with HD probably because of the chronic straining, as are inadequate fiber intake and prolonged lavatory sitting [3-5]. However, some studies failed to demonstrate any correlation between chronic constipation and HD, and others demonstrated that diarrhea may also lead to HD, possibly due to the increased resting anal pressure required to maintain fecal continence [6, 7]. Overweight and certain professions, such as those involving heavy labor, have also been reported to be associated with the disease [6, 8]. Lifestyle factors, such as smoking, alcohol intake and excessive coffee consumption, are also often implicated, but reported data are inconsistent [2, 8]. The most common symptom of HD is painless rectal bleeding associated with bowel movement [1, 3]. Other signs and symptoms include hemorrhoidal prolapse, anal swelling, anal pain, discomfort, discharge, soiling and pruritus [2].
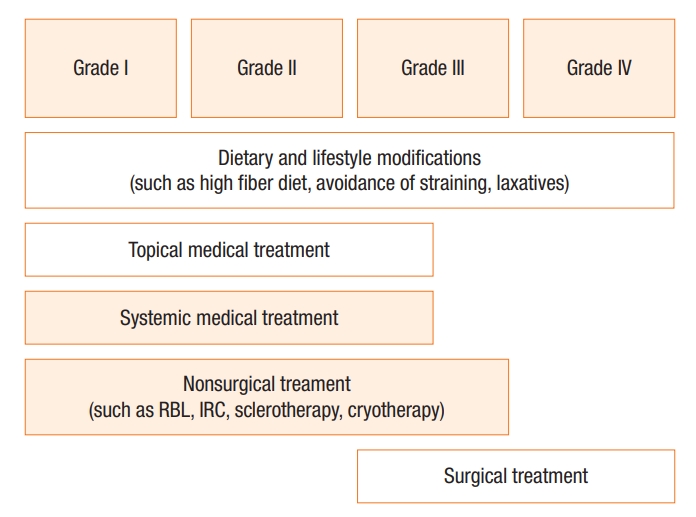
The therapeutic strategy for treating patients with HD can range from dietary and lifestyle modification to medical treatment and even to surgery, according to the severity of the symptoms and the degree of the HD [9, 10]. Lifestyle modifications should be advised to patients with any degree of hemorrhoids [2, 10, 11]. The conservative strategy recommended for first- and second-degree hemorrhoids includes pharmacological oral treatment that comprises phlebotonic agents [12, 13]. Daflon (Les Laboratoires Servier, Suresnes, France), the most studied phlebotonic agent, is a micronized purified flavonoid fraction (MPFF) composed of 90% micronized diosmin and 10% flavonoidsŌĆöhesperidin. This phlebotropic drug increases venous tone, reduces stasis, inhibits inflammatory mediators and enhances lymphatic drainage [12, 13]. Regarding the instrumental therapies for early symptomatic hemorrhoids, rubber band ligation (RBL) is the most efficient and commonly used strategy [14, 15]. Other instrumental techniques are sclerotherapy, cryotherapy, infrared coagulation, laser therapy, and diathermy coagulation [9, 10]. HD may not respond to nonsurgical therapies, or patients may not accept or tolerate office procedures. Surgical treatments can be an option in these settings and should also be considered the first choice of treatment for patients with large symptomatic third- and fourth-degree hemorrhoids [3, 9]. Fig. 1 shows the GoligherŌĆÖs classification of HD, as well as the therapeutic options available for each grade of HD [1, 2].
The most popular nonsurgical treatments are MPFF and RBL. Both, alone or combined, can be applied to patients with first- to third-degree hemorrhoids, according to the gastroenterologist personal criteria. To our knowledge, no studies have investigated the efficacy of MPFF and RBL together. A study with 351 patients compared the efficacy of infrared coagulation plus MPFF versus each treatment used alone and confirmed a favorable effect of MPFF as an adjunctive therapy to infrared coagulation in terms of bleeding [16]. Other studies evaluated the effect of MPFF after a hemorrhoidectomy and found favorable results. Ho et al. [17] showed a decreased risk of secondary bleeding after postoperative MPFF treatment. Colak et al. [18] reported that MPFF reduced the severity of pain in a study of 112 surgical patients. La Torre and Nicolai [19] showed a reduction in pain, tenesmus, pruritus and bleeding after postoperative MPFF treatment in 50 surgical patients. Our aim is to compare the efficacy of the most frequently nonsurgical strategies used either alone or in a combined approach in an ambulatory setting.
METHODS
This longitudinal cohort study took place between May and November 2017 in the Gastroenterology Department of Braga Hospital. The study was performed in accordance with the Declaration of Helsinki and was approved by the Ethics Committees of Braga Hospital and Life and Health Sciences. All participants provided signed written informed consent. Anonymity and confidentiality of the clinical data collected were granted in this study.
Outpatients who underwent systemic medical and/or instrumental treatment during a proctology appointment at the Gastroenterology Department of Braga Hospital were invited to participate in the study. Patients over 18 years of age with HD (grades I, II, or III) who presented with rectal bleeding, pruritus, pain or prolapse and who underwent conservative treatmentŌĆösystemic medical and/or instrumentalŌĆöwere included in this study. Patients who were being treated with topical medication, who had HD grade IV, concomitant colonic or anorectal diseases, who had a history of pelvic radiation or colorectal cancer, and who were unable to provide informed consent were excluded. Sociodemographic characteristics, including age, sex, body mass index (BMI, defined as underweight <18.5 kg/m2, normal weight from 18.5ŌĆÆ24.9 kg/m2, overweight from 25ŌĆÆ29.9 kg/m2, and obese >30 kg/m2), current medication, eating habits, and bowel habits, were recorded. To evaluate the eating habits, we adapted the Mediterranean Diet Pyramid and formulated a diet questionnaire [20]. Based on the number of ŌĆ£yesŌĆØ answers, we classified the patientsŌĆÖ diets as healthy (5 or more yes answers), average (3 to 4 yes answers), or poor (0 to 2 yes answers). To evaluate the prevalence of constipation, we used the Rome IV criteria [21].
Symptoms and signs of HD were recorded using the Sodergren score, a validated symptom severity scoring system [22]. Patients were asked to self-assess the severity of pruritus, the pain at rest and the pain during defecation throughout the last month according to a scale from 0 to 5 (0, no symptoms to 5, severe symptoms). The frequency of prolapse was also reported according to a frequency scale (0, none; 1, less than once a month; 2, more than once a month; 3, more than once a week; 4, every day). Because bleeding is not considered in the Sodergren score, it was assessed separately using a similar scale from 0 (no symptoms) to 5 (severe symptoms). To assess the overall severity of the HD, we created a Global Symptom score ranging from 0 to 24, which included bleeding and the described subitems from the Sodergren score. The Global Symptom score was calculated by adding up the mean score of each symptom (Table 1).
The durations and the types of previous treatments for HD were also recorded, as were the results of anoscopic examinations and the treatment strategies decided during the proctology appointments by the gastroenterologist specialists. The most frequently applied strategies defined our comparative groups: patients in the MPFF alone group (MPFF group) were prescribed Daflon 500 mg (MPFF) for 7 days at a dose of 3 tablets twice per day for the first 3 days, followed by 2 tablets twice per day from day 4 to day 7. Patients in the RBL group underwent RBL; the ShortShot Saeed Hemorrhoidal Multi-Band Ligator with TriView Anoscope from Cook Medical (Bloomington, IN, USA) is the equipment used in Braga Hospital for RBL. The patients in the combined strategy group (RBL+MPFF group) first underwent RBL, after which Daflon 500 mg (MPFF) was prescribed for 7 days (at the same doses described above).
On day 7 (T7) and on day 28 (T28), a telephone interview was performed to reevaluate the hemorrhoidal symptoms by using the same scoring procedure as was applied at T0. Three time-intervals were defined to evaluate the evolutions of the symptoms and to compare the mean symptom score differences: the initial time from T0 to T7 = T0-7, the second time from T7 to T28 = T7-28, and the total time = T0-28. The Global Symptom score was calculated at T7 and T28 to compare the overall improvement of the HD in each group.
Analyses were conducted with IBM SPSS Statistics ver. 22.0 (IBM Co., Armonk, NY, USA). For quantitative variables with symmetric distributions, results were presented as means and standard deviations; for categorical variables, frequencies and percentages were calculated. The normality assumption was verified using the Shapiro-Wilk test. A t-test for independent samples was used to compare quantitative variables, and chi-square or Fisher exact test was used for categorical variables. A mixed betweenwithin subjects analysis of variance was used to compare the symptoms scores in the treatment groups along the 3 time points (T0, T7, and T28), considering the interaction effect of the type of treatment, and to compare symptom scores between treatments for each period of assessment. The Greenhouse-Geisser correction was used to calculate the P-value when variance homogeneity was not ensured (evaluation by Levene test for equality of variances). Statistical significance was considered for P < 0.05.
RESULTS
The study population included 54 patients, of which 8 patients were excluded for having at least one exclusion criterion. In addition, only 2 patients underwent systemic medical treatment alone (MPFF group), so we excluded them as statistical analyses could not be performed with such a small group. Therefore, only 2 of the 3 treatment groups described above, the RBL+MPFF group with 19 patients and the RBL group with 25 patients for a total of 44 patients were included in this study. No patients were lost to follow-up. The demographic characteristics of the study population are described in Table 2. Eighteen participants (40.9%) were male and 26 (59.1%) were female, and the mean age of the participants was 58.4┬▒11.5 years. The majority of patients were overweight (45.5%) or obese (34.1%), with a mean BMI of 28.1┬▒4.4 kg/m2. In terms of eating habits, 22 patients (50%) described a healthy diet, 19 (43.2%) an average diet and 3 (6.8%) a poor diet. Seventeen patients (38.6%) were constipated and 5 (11.4%) took laxatives often. Twenty-four patients (55.8%) took medication (at least one class) associated with constipation (iron supplements, calcium supplements, antidepressants, antihistamines, beta blockers, or proton-pump inhibitors). No statistically significant differences were found between the 2 groups (P > 0.05). A total of 8 patients (18.2%) presented with grade I hemorrhoids, 32 patients (72.7%) with grade II hemorrhoids, and 4 patients (9.1%) with grade III hemorrhoids. Most patients (90.9%) had had HD for more than 12 months, and 10 patients (22.7%) had undergone previous treatment. No statistically significant differences regarding the HD at baseline (Tables 3, 4) were found between the 2 groups. Differences in the evolutions of the symptoms and the signs between groups in terms of scoring are presented in Table 4. Mean symptom score differences between the 3 time points for each treatment are presented in Table 5.
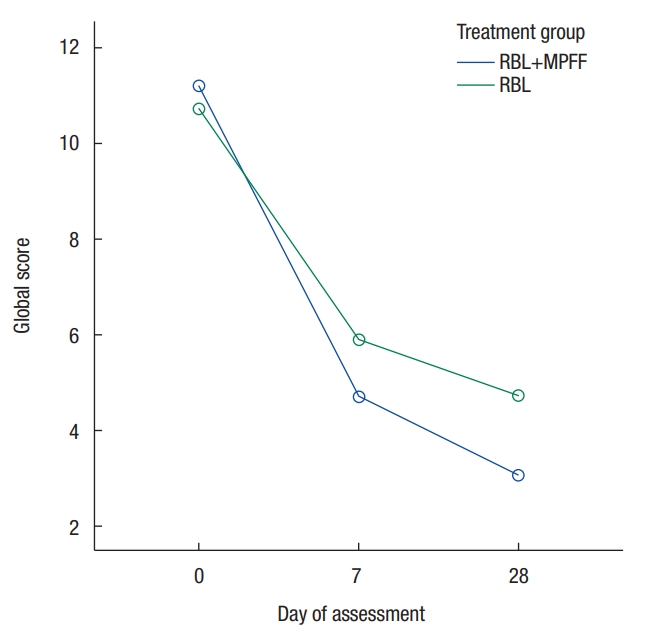
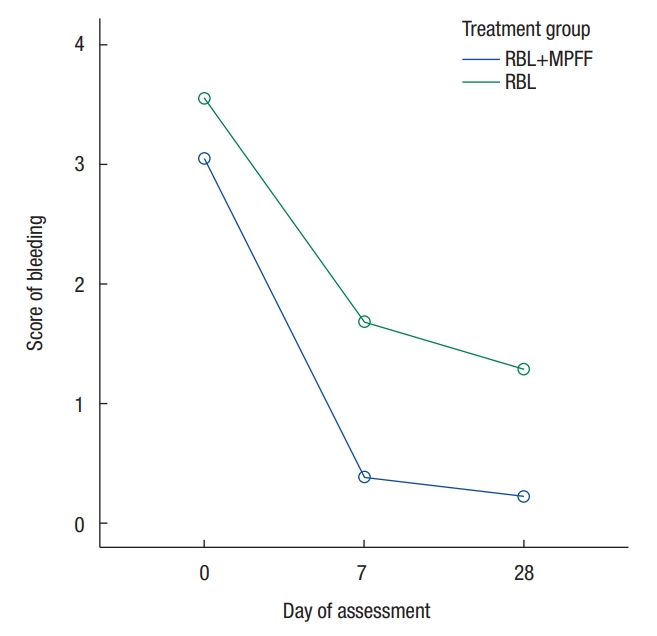
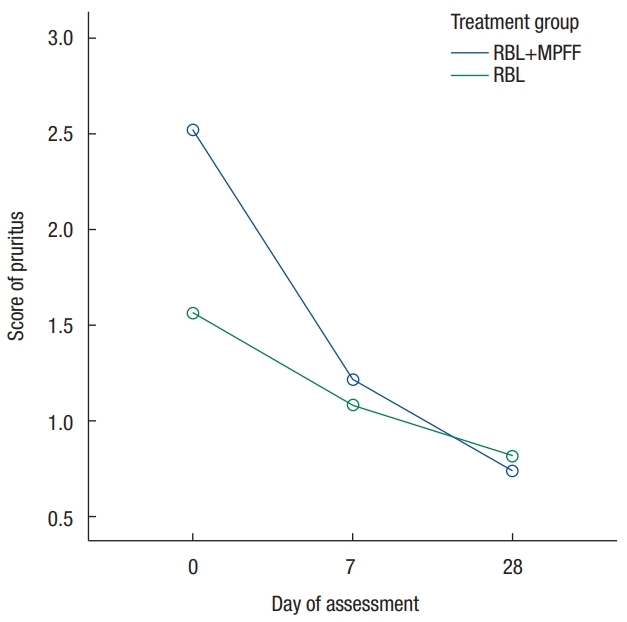
Analysis of the Global Symptom score showed an overall improvement of HD symptoms in both groups during the study period (T0-28; P < 0.001). This effect was noticed immediately during the first week (T0-7), with a significant mean score reduction being observed in both treatment groups (P < 0.001). A comparison of the 2 strategies showed a trend in favor of the combined treatment in terms of mean symptom score reduction (P = 0.51) (Fig. 2). Both treatments showed a significant improvement in bleeding during the first week (T0-7), which was sustained over the total time (T0-28) (P < 0.001). A comparison of the 2 types of intervention (Fig. 3) showed in the RBL+MPFF group the decreases in the bleeding mean scores at T7 (P = 0.001) and T28 (P = 0.002) were significantly different from those in the RBL group (P = 0.003). Both treatment groups showed a significant reduction in pruritus intensity over the total time (T0-28; P < 0.01). During the first week (T0-7), the combined treatment group showed a greater reduction (P < 0.001) than the RBL treatment group (P = 0.07). The evolution curve of the pruritus mean score reduction in Fig. 4 is significantly better for the combined treatment group (P = 0.03). Regarding the other parametersŌĆöpain at rest, pain at defecation, and prolapseŌĆöno substantial improvements were observed in either of the 2 groups at any time during the treatment (T0-28; P < 0.05). A comparison of the 2 types of intervention showed no differences in the mean score between the 2 groups for pain at rest at T7 (P = 0.93) and at T28 (P = 0.58), but that comparison showed significant mean score reductions for pain at defecation in the RBL group during the first week (T0-7; P = 0.004) and a marginally significant reduction for the RBL+MPFF group (P = 0.07). During the following weeks (T7-28), only the patients in the combined treatment group maintained a sustained improvement (P = 0.007). For prolapse, the comparison of both strategies showed no differences in the mean score reductions between the groups at T7 (P = 0.51) and T28 (P = 0.85).
Nine patients (20.5%) described secondary effects after the RBL procedure. Mild pain, which was reported by 7 patients (15.9%) during the first 3 days, was the most common complication. This was followed by secondary haemorrhage, which was reported by 2 patients (4.5%) about 2 weeks after banding.
DISCUSSION
Several nonsurgical options can be used to treat patients with HD. We decided to evaluate the systemic medical treatment and the instrumental treatment because the focus of our interest was the conservative treatment of patients with HD during a proctological consultation in a hospital setting. In the Primary Care System, lifestyle modifications and topical medical treatments are considered everyday standard-of-care treatments for patients with HD. RBL is the instrumental treatment used at Braga Hospital, and several studies have confirmed its superiority over other instrumental methods [9, 10]. Some clinicians choose to combine MPFF with RBL, based on the pharmacological effect of flavonoids in reducing HD symptoms and their experience with the drug. Accordingly, 2 treatment groups were eligible for evaluationŌĆöthe RBL alone group and the combined RBL+MPFF group. Not enough patients (only 2) were available to create a third treatment group of medical treatment (MPFF) alone.
Regarding the demographic characteristics of our study population, the mean age of our patients was 58 years, and the proportion of males to females 1.4:1, which is in accordance with what is described in the current literature [8]. Our results support excessive weight as a risk factor for HD because most of our patients were overweight, having a mean BMI of 28 kg/m2 [6]. In our study, 61% of the patients did not report constipation, calling into question the impact of this condition as a risk factor for HD. In our study population, 50% of our patients reported a healthy Mediterranean diet while only 6.8% reported a poor diet. These results question the influence of a healthy diet in the prevention of HD. However, our patients may have overestimated the qualities of their diets and reported healthier diets than they truly had; the fact that the majority of our patients were overweight supports this supposition.
The Global Symptom score showed an overall improvement of HD for both treatments throughout the study period, with a trend showing a benefit for adding MPFF to RBL. Regarding bleeding, patients treated with the combined treatment showed higher clinical benefit in comparison to RBL alone both in the immediate follow-up (first week) and afterwards (1 month later). This may be attributed to MPFFŌĆÖs protective effect against capillary fragility. Regarding pruritus, during the first week and throughout the follow-up time, the addition of MPFF to RBL had a greater impact in reducing the severity of this symptom. This suggests that MPFF may be beneficial in the acute setting of more pruritic HD. In terms of pain at rest and at defecation, although both treatments were effective at reducing the symptoms, in the second-time interval (T7-28), a trend was seen that favored the combined treatment. Perhaps the reduction in pain at defecation was more pronounced in the RBL alone group in the first week because of the promptest relief associated with the isolated fall of the elastics without the steady anti-inflammatory effect of the MPFF. The anti-inflammatory effect of MPFF in the combined treatment group probably makes the reduction in the pain at defecation less pronounced but more sustained over time. Regarding prolapse, although the combined treatment showed a steeper symptomatic decrease during the first week, no significant differences between the 2 treatments were seen at the end of the evaluation. No unexpected complications after RBL were described, and our results are in accordance with those in the literature [15].
Some limitations were identified in our study. First, our sample size was small, which limits the extrapolation of our results. Moreover, our study was designed as a longitudinal cohort study, differing from other studies which involved randomized controlled trials. A multicenter study, with a larger patient population and randomization, could highlight our results. Second, our reevaluation was based on a subjective assessment of HD symptoms, which was performed by telephone interview.
According to our study, MPFF as an adjunctive therapy to RBL has a clinical benefit in the treatment of patients with hemorrhoid disease. A 7-day treatment with MPFF after RBL significantly reduced the intensity of bleeding during the first month. Additionally, the combined treatment showed a favorable effect in that it reduced pruritus in an acute setting. This combined treatment showed a trend of being clinically beneficial for reducing the severity of all HD symptoms, but verification of this finding through a study with a larger sample size would be important to strengthen our results.