


Graphical Abstract
INTRODUCTION
An anal fissure results from an elliptical or longitudinal tear in the squamous epithelial tissue distal to the dentate line and is usually located in the posterior midline of the anus. The disease, which causes severe pain in the anal area, impairs quality of life and can adversely impact work productivity [1, 2]. The disease can be acute or chronic [3]. In an acute anal fissure, only the epithelial tissue is ruptured, with pain in the anal region, with symptoms of defecation and bleeding lasting less than 2 months. In a chronic anal fissure, symptoms last longer than 6 to 8 weeks; in addition to the symptoms noted above, it is characterized by exposed fibers of the internal anal sphincter at the base of the fissure, hypertrophied anal papillae at the proximal end, and skin tags at the distal [4]. The disease affects both sexes equally in all age groups [5]. Most anal fissures are acute and resolve spontaneously or within 6 to 8 weeks of treatment [6]. Although its etiology is not known exactly, it is thought to be multifactorial and can be the result of spontaneous internal anal sphincter spasm, ischemia, infection, and local trauma [7]. In the treatment of acute anal fissure, conservative treatments such as a fiber-rich diet, regular toilet habits and warm sitz baths, muscle relaxants, and blood flow enhancing drugs such as diltiazem and anesthetic drugs are generally used [3, 8, 9]. Topical nitrates and botulinum toxin are not preferred because of the rapid disappearance of their effects and undesirable side effects [10]. Surgical lateral internal sphincterotomy is applied as the gold standard treatment in patients, who do not respond to medical treatments. However, surgical risks and the incidence of late persistent incontinence are important postoperative complications [11, 12].
In recent studies, it has been reported that there can be subclinical infection mostly due to the presence of anaerobic bacteria in the anal fissure region, and the use of topical or oral antibiotics in addition to conventional medical treatment increases wound healing and reduces pain [7, 13, 14]. In studies on this subject, the effect of local or systemic antibiotics was mostly performed on patients with chronic anal fissure.
In this study, our aim is to investigate whether the use of topical metronidazole, which is effective against anaerobic bacteria, which are claimed to cause subclinical infection in the anal fissure, in addition to diltiazem, a calcium channel blocker that has been used for years in the treatment of acute anal fissure, are superior to the use of diltiazem alone.
METHODS
A total of 100 patients admitted to the General Surgery Clinic of Istanbul Medipol University Faculty of Medicine Hospital (between December 2020 and May 2021) and diagnosed with acute anal fissure were included in our prospective randomized controlled double-blind study. The study was performed with the approval of the Clinical Research Ethics Committee of Faculty of Medicine, Istanbul Medipol University (November 11, 2020; No. 851). Informed consent was obtained from all patients.
Patients older than 18 years, with complaints of anal fissure for less than 8 weeks, anal fissure lesions limited to the epithelium on physical examination, and no findings suggestive of chronic anal fissure (such as skin tag in the anal region) were included in the study. Patients with perianal fistula and perianal abscess; with concomitant inflammatory bowel disease and immunodeficiency; taking oral immunosuppressants or steroids; with a history of hemorrhoidectomy; with chronic diseases such as ischemic heart disease, hypertension, or migraine; who were pregnant; and who were already treated with other topical creams were excluded from the study.
Patients were randomly divided into 2 groups of 50 people, with participants choosing color-coded cards in thick white envelopes. Patient medication was delivered by a doctor who saw the color of the cards and was not one of the coordinators of our study. All patients and all the investigators evaluating them were blinded to randomization. As a calcium channel blocker, only 2% diltiazem cream (Locafen 2% cream; Ilko Ilac Sanayi ve Ticaret A.S., Istanbul, Turkey) was used for patients in group 1, and 2% diltiazem cream and metronidazole cream (Rosa cream [1% metronidazole]; ORVA Ilac Sanayi ve Ticaret A.S.) were used for patients in group 2. Demographic characteristics of all patients were recorded, a detailed anamnesis was taken, and physical examination was performed before the start of treatment. Pain complaints during defecation were evaluated with the visual analogue scale (VAS) [15]. All patients were instructed to circulate each pea-sized drug 1ŌĆō2 cm into the anus with the tip of the index finger 3 times a day for 6 weeks. They were also advised to eat a fiber-rich diet and take a 15-minute warm bath 3 times a day. No stool softener or topical analgesic cream was prescribed to the patients during the treatment. At the end of the 1st, 4th, and 6th weeks of treatment, the patients were called for control visits and examined, and their VAS scores were recorded.
The effectiveness of the treatment was evaluated according to the level of healing of the fissure and the severity of the pain. The fissure was visually inspected and evaluated at each visit, while the degree of epithelization was determined as follows: 0, no epithelialization in the fissure; 1, there is epithelialization in the fissure; and 2, the fissure is fully healed. The VAS score was used to measure pain after defecation. The scale is divided into 10 equal parts; 0 indicated no pain and 10 indicated unbearable pain. Clinical improvement was considered as complete reepithelialization of the anal canal mucosa and closure of the fissure without erythema or inflammation and relief of patient complaints.
Statistical analyses
IBM SPSS ver. 26.0 (IBM Corp) was used in the analysis of the variables. The conformity of univariate data to normal distribution was evaluated with the Shapiro-Wilk Francia test. The Mann-Whitney U-test was used together with Monte Carlo results to compare 2 independent groups with each other according to quantitative data. While Friedman 2-way test was used to compare the measurements of dependent quantitative variables with more than 2 replicates with each other, Monte Carlo simulation results were used, and the stepwise stepdown comparisons test was used for the post hoc test. The McNemarBowker test was used with the Monte Carlo simulation technique to compare the variables with 2 dependent categories. In the comparison of categorical variables with each other, the Pearson chisquare and Fisher exact tests were used with the Monte Carlo simulation technique, and column ratios were compared with each other and expressed according to Benjamini-Hochberg corrected P-value results. Quantitative variables were expressed as medians (interquartile ranges, IQRs) in the tables, while categorical variables were shown as numbers (%). Variables were analyzed at a 95% confidence level, and P< 0.05 was considered to be significant.
RESULTS
Of the 100 patients included in the study, 90 were female and 10 were male. The median (IQR) age of the patients in group 1 was 32.5 years (28ŌĆō48 years); and in group 2, it was 32 years (25ŌĆō45 years). Forty-six patients (92.0%) in group 1 and 44 (88.0%) in group 2 were female. Pain symptoms were present in defecation in all patients in both groups. Constipation and bleeding during defecation were detected in 44 (88.0%) and 43 patients (86.0%) in group 1, and in 44 (88.0%) and 38 patients (76.0%) in group 2, respectively. The medians (IQRs) of the duration of pain, bleeding time, and constipation duration of the patients were detected to be 4 weeks (2ŌĆō4 weeks), 4 weeks (2ŌĆō4 weeks), and 4 weeks (3ŌĆō5.5 weeks) in group 1, and 3 weeks (2ŌĆō4 weeks), 3 weeks (2ŌĆō4 weeks), and 4 weeks (4ŌĆō8 weeks) in group 2, respectively. There was no statistical difference between group 1 and group 2 in terms of age, sex, pain at defecation, presence of bleeding, presence of constipation, duration of pain, duration of bleeding, and duration of constipation (P> 0.05) (Table 1).
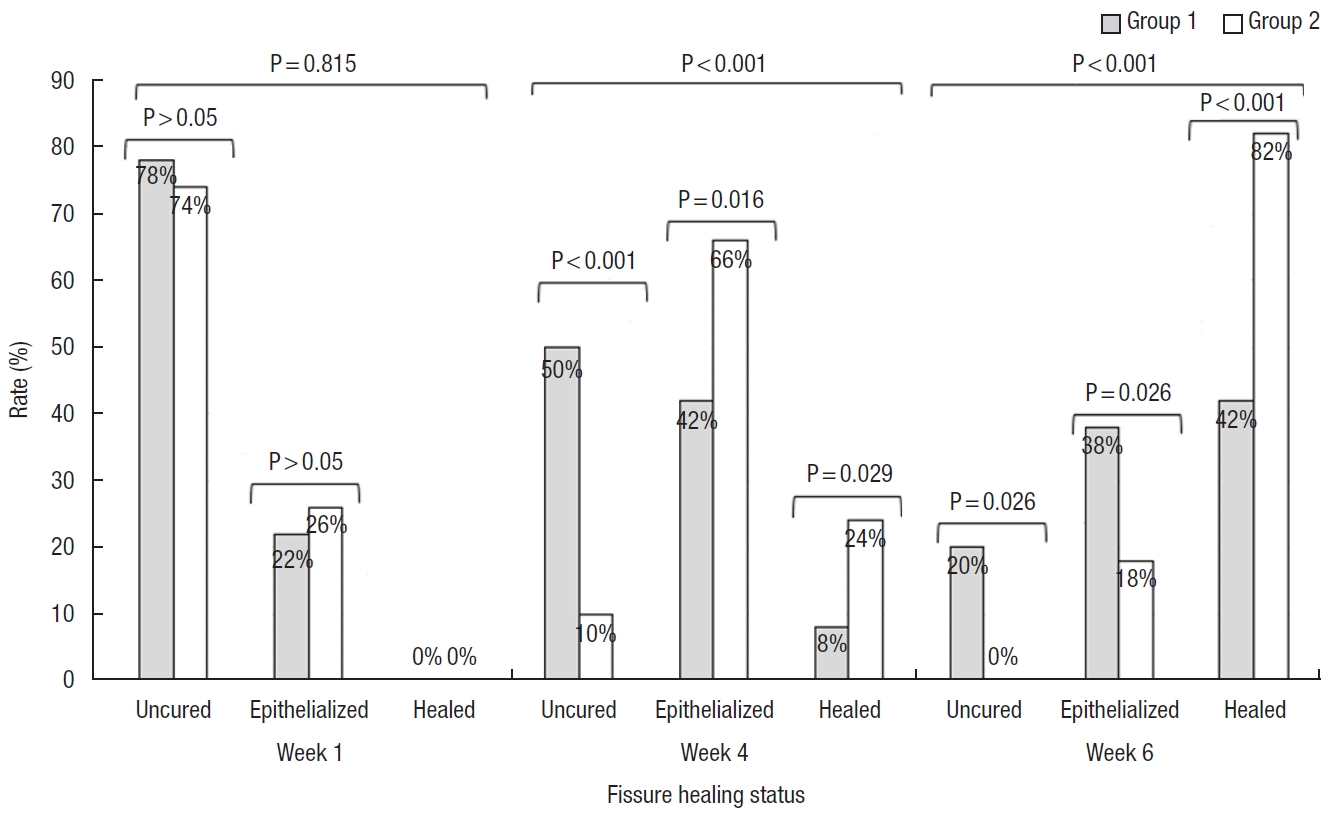
At the end of the 4th week, only 4 patients (8.0%) in group 1 had complete recovery; while in group 2, 12 patients (24.0%) had complete recovery. At the end of the 6th week, 21 patients (42.0%) in group 1 and 41 patients (82.0%) in group 2 had fully recovered. When the groups were compared in terms of physical examination findings and recovery rates, it was found that both epithelization and the healing rates of the patients in group 2 were statistically significantly higher than those in group 1 from the 1st week (P< 0.001) (Fig. 1 and Table 2).
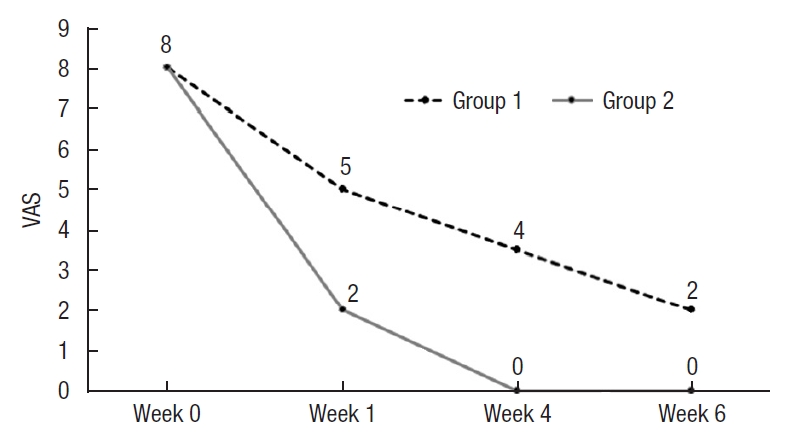
The median (IQR) VAS score levels were found to be 8 (6ŌĆō8) in group 1 and 8 (7ŌĆō9) in group 2, respectively, on the day of enrollment. At the end of the 1st week of treatment, the median (IQR) VAS score decreased from 8 to 5 (4ŌĆō7) in group 2, while it decreased from 8 to 2 (1ŌĆō2) in group 2. At the end of the 1st week, 25.0% of the patients in group 1 still had a VAS score above 7. At the end of the 4th week, while the VAS score decreased from a median of 8 to 3.5 (IQR, 2ŌĆō5) in group 1, the VAS score had decreased from a median of 8 to 0 (IQR, 0ŌĆō1) in group 2. At the end of the 4th week, the VAS score was still above 5 in 25.0% of the patients in group 1. When the groups were compared in terms of VAS scores detected on the day of enrollment and follow-up, it was found that the VAS scores of the patients in group 2 decreased much more rapidly after the 1st week, in line with the physical examination findings (P< 0.001). In group 2, the VAS score started to decrease rapidly from the 1st week and there were almost no patients with pain in the 4th week. The VAS scores of the patients in group 1 decreased at a slower rate and at the end of the 4th week, it was found that group 2 could only reach the VAS score level that group 1 reached in the 1st week (P= 0.073) (Fig. 2 and Table 3).
DISCUSSION
In our study, it was shown that the use of diltiazem and topical metronidazole for the treatment of acute anal fissure, compared to the use of topical diltiazem alone, reduced the severity of pain in a very short period of time and both shortened the healing time of the fissure and increased the healing rate.
Acute anal fissure affects both men and women equally [5]. We think that the reason for the higher number of female patients in our study was due to the fact that the surgeon who performed the anal examination and treatment of patients was female. Due to sociocultural reasons, especially in some regions of our country, female patients prefer female surgeons for perianal and genital examinations.
Typical presenting symptoms in acute anal fissure are pain on defecation and bleeding. Pain is usually sharp and aggravated during defecation, sometimes painful defecation may be accompanied by bleeding [16]. Similar to the literature, all of our patients had complaints of pain at defecation, and pain scores were found to be very high before starting treatment. In addition, defecation was accompanied by bleeding in 81.0% of the patients.
Spasm is known to occur in the internal anal sphincter in acute anal fissure [17]. Warm sitz baths contribute to the relaxation of the internal anal sphincter and the healing of the anal fissure through the somatoanal reflex [18]. Approximately half of acute anal fissures have been reported in studies to heal with only warm sitz baths and fiber diet intake [19]. In studies on etiology, due to the inadequate response of some patients to treatment, it has been shown that the bacteria found in the anal fissure area in 90% of patients with chronic anal fissure do not match the bacteria found in the stool flora of the same patients, Escherichia coli was reported to be one of the main causes [14]. In light of these data, in a study involving the topical application of povidone-iodine solution in chronic anal fissure, it was revealed that it contributed positively to the treatment. In the following years, in another study by the same authors, it was reported that chronic anal fissure could be treated with topical or systemic antibiotic treatment by preventing constipation [14]. In a study of Grekova et al. [13], of chronic anal fissure, after 4 weeks of conventional treatment, a 71% improvement was found in the control group, while complete recovery was achieved in 95.6% of the patient group in which topical metronidazole was added to the conventional treatment. Unlike previous studies, Karapolat [7] reported that a 44% improvement was found in the control group with 4 weeks of topical lidocaine treatment in acute anal fissure, while an improvement of 86% was achieved in the group that added topical metronidazole to topical lidocaine treatment. In our study, similar to the literature, complete recovery was achieved in 42.0% of patients in the 6th week of treatment, using only topical diltiazem, while complete recovery was achieved in 82.0% of patients using topical diltiazem and metronidazole. In addition, it was shown that the increase in the rate of complete recovery started from the 1st week of treatment compared to that in the control group.
Alvandipour et al. [20] reported that the mean VAS score level of the patients, who had received topical diltiazem treatment in the treatment of chronic anal fissure was 3.2┬▒ 0.25 at the beginning of the treatment, and the VAS score level was reduced to 2.32┬▒ 0.32 at the end of 1 month of treatment. On the other hand, in a study by Martellucci et al. [21], evaluating patients with acute anal fissure, the median VAS score was 7.1 (range, 2ŌĆō10) at the beginning of the treatment, and 1.7 at the end of 1 month of treatment. In a retrospective study of patients with acute anal fissure, Emile et al. [22] reported that the mean VAS score level was 8.8 ┬▒ 0.96 before treatment, and the mean VAS score level was 0.47┬▒ 0.8 after 6 weeks of treatment. Unlike the above studies, in patients with chronic anal fissure, Grekova et al. [13] reported that the VAS score level decreased in a shorter period of time from the day the treatment was started in the patient group using topical metronidazole compared to the period required for a similar decrease in the non-user group. Carrying out similar treatment in patients with acute anal fissure, Karapolat [7] reported that the VAS score levels of patients, who had received topical metronidazole treatment was significantly lower at the 2nd and 4th weeks of treatment compared to those of the patient group, who did not receive topical metronidazole treatment. In our study, similar to the literature, it was found that the VAS score level had decreased further in the patient group using topical metronidazole from the 1st week of treatment compared to the level of decrease in the group using diltiazem alone. In addition, in our study, it was shown that the VAS score level attained by the patient group using topical metronidazole in the 1st week of treatment was only achieved in the 4th week by the group using diltiazem alone.
Our study has several limitations. First, the long-term recurrence rates are unknown due to the short follow-up period. The second limitation is that most of the patients included in the study were female. Despite these limitations, we think that our study contributes to the treatment of acute anal fissure in the adult age group.
In conclusion, with the addition of topical metronidazole to conventional treatment, the reduction of acute anal fissure-related pain in a short period of time, the shortening of the healing time of the fissure, and the high rate of healing indicate that infection plays an important role in the etiology of anal fissure. The use of topical metronidazole as an adjunct to conventional treatment may result in lower chronicity of acute anal fissures and avoidance of surgical interventions with high complication rates. We think that there is a need for new studies in which different topical antibiotic therapy options are employed.