


INTRODUCTION
Colorectal cancer is the third most common cancer encountered worldwide in terms of incidence and mortality [1]. Rectal cancer is more difficult to treat than colon cancer, especially in the locally advanced stage. Due to its proximity to the pelvic organs in the narrow pelvic cavity and the absence of serosa surrounding the rectum, it is consequently prone to adjacent organ invasion, intraoperative tumor perforation, and tumor cell spillage, thereby increasing the possibility of local recurrence. There are several methods to improve oncologic outcomes in the treatment of locally advanced rectal cancer (LARC). First, a good understanding of the surgical planes could lead to successful total mesorectal excision (TME) [2]. Second, adjuvant treatment via postoperative chemoradiation (CRT), as well as the combination of TME and CRT, can reduce local recurrence and improve survival [3]. Moreover, in the last 2 decades, neoadjuvant CRT (nCRT) has been suggested to result in a better tumor response in a well-vascularized and oxygenated tumor environment during the preoperative period than radiation in the fibrotic surgical field after surgery; indeed, nCRT can decrease the local tumor volume, chances of viable tumor cell spillage, and number of circulating tumor cells [4]. A landmark study, the German CAO/ARO/AIO-94 [5] with a median follow-up of 11 years, showed a significant persistent improvement of preoperative CRT in terms of local control, although it had no effect on overall survival (OS). These findings suggest that nCRT not only improves local recurrence but also is associated with increased anal sphincter preservation and minimizes the side effects of CRT.
There are ongoing efforts to identify surrogate parameters or clinicopathological factors that are associated with OS and relapse-free survival (RFS) after nCRT for the treatment of LARC. Tumor regression grade (TRG), one of the parameters used to evaluate tumor response after nCRT, may be related to long-term oncologic outcomes in LARC [6, 7], especially in pathological complete response (pCR). While pCR has been reported to be associated with better OS than non-pCR [8], different results have been reported in terms of partial tumor regression [9].
TRG has been classified using several classification systems such as the Mandard et al. [10], Dworak et al. [11], and American Joint Committee on Cancer classifications [12]. A previous study found that the Mandard TRG classification reported more accurate results than the Dworak classification when classifying tumor response and prognosis in terms of local recurrence and OS [13]. Therefore, in the present study, we used the Mandard classification to assess the degree of tumor response. Moreover, a previous study found other factors related to poor survival rates, including old age, high postoperative serum carcinoembryonic antigen (CEA), pathological stage T4 (or node-positive) results, poor tumor differentiation, perineural invasion (PNI), and surgical margin positivity [14]. Accordingly, in this study, the primary objective was to determine the correlations between TRG and 5-year OS in LARC after nCRT followed by surgery, and the secondary objectives were to examine the correlation between TRG and 5-year RFS and determine other factors influencing long-term oncologic outcomes in LARC.
METHODS
Ethical statements
This study was approved by the Ethics Committee of the Faculty of Medicine, Prince of Songkla University (No. 58-381-10-1). The requirement of obtaining informed consent was waived because of the retrospective nature of this study. We conducted this study in compliance with the principles of the Declaration of Helsinki.
Patients and treatments
This study was a retrospective review of patients with LARC who received nCRT followed by oncologic surgery from January 1, 2010 to December 31, 2015, at Songklanagarind Hospital, the largest tertiary care center in southern Thailand. All patients aged > 18 years who were diagnosed with clinical T3/T4 (cT3/cT4) and/or N+ adenocarcinoma of the rectum were enrolled. Rectal cancer was defined by the location of the tumor being less than 15 cm from the anal verge. Patients who had distant metastasis, concomitant malignancy, and/or previous history of pelvic irradiation were excluded. All patients underwent preoperative staging based on computed tomography (CT) of the chest and abdomen, magnetic resonance imaging (MRI) of the rectum, colonoscopy with a biopsy, and the preoperative CEA level. All patients underwent long-course nCRT with a fluoropyrimidine-based chemotherapy regimen with a total dose of 45.0–50.4 Gy in 25–28 daily fractions of radiation. Postneoadjuvant restaging was performed by CT scan of the chest and abdomen, and MRI of the rectum, followed by partial mesorectal excision for upper rectal cancer or TME for mid- or low-rectal cancers. The radiation therapy fields included the tumor or tumor bed with a 2–5-cm margin, the mesorectum, the presacral nodes, and the internal iliac nodes. There were 2 protocols of fluoropyrimidine-based chemotherapy, and the choice of the protocol was based on the age or medical condition of the patient: (1) 5-fluorouracil (5FU) 400 mg/m2 and leucovorin 20 mg/m2 delivered by intravenous injection in the first and last weeks of radiation therapy, or (2) capecitabine 825 mg/m2 administered orally twice daily in combination with concurrent radiation for 5 weeks. Adjuvant chemotherapy was delivered for a total duration of 6 months perioperatively.
Follow-up examinations
All patients were followed up with a clinical examination, including analysis of the serum CEA level every 3 months for the first 2 years, followed by analysis every 6 months for a total of 5 years. Chest and abdominopelvic CT were performed annually until 5 years postoperatively. A colonoscopy was performed approximately 1 year after resection. If there was an advanced adenoma (defined as a villous adenoma), > 1-cm polyp, or high-grade dysplasia, the colonoscopy was repeated within 1 year. If there was no advanced adenoma, the colonoscopy was repeated after 3 years and then every 5 years. For patients with an incomplete colonoscopy before the operation, the colonoscopy was performed again within 3 to 6 months postoperatively. In cases of clinical suspicion of recurrence or an elevated CEA serum level during follow-up, chest and whole abdominal CT and/or colonoscopy was performed to confirm cancer recurrence or metastasis.
Pathological examinations
Pathological results were reported by experienced pathologists based on the following parameters: cell type and degree of tumor differentiation, post-CRT pathological staging (ypT, ypN, and ypstage), TRG based on the Mandard classification, lymphovascular invasion (LVI) and PNI, tumor deposits, proximal and distal margins, and circumferential resection margin (CRM). Mandard et al. [10] proposed classifying TRG into 5 different groups: TRG 1, the absence of residual cancer; TRG 2, the presence of residual cancer cells scattered throughout the fibrosis; TRG 3, increase in the number of residual cancer cells but fibrosis still being predominant; TRG 4, residual cancer outgrowing fibrosis; and TRG 5, the absence of regressive changes. The dates and sites of local or systemic recurrences were recorded. Information regarding deaths was retrieved from death certificates issued by the government civil registration office, which provide the date, location, and cause of death.
Statistical analyses
Data collected included demographic data; the surgical waiting interval; and other preoperative, intraoperative, and postoperative variables. Information on the diagnosis date, operative date, recurrence date, and death date, if applicable, was collected. Continuous variables were compared using Student t-test or the Wilcoxon-Mann-Whitney test. Categorical variables were compared using the Pearson chi-square test or Fisher exact test. The 5-year OS and RFS rates analyzed using Kaplan-Meier survival curves were compared between the different TRG groups. A log-rank test was used to evaluate statistical significance. pCR and other factors influencing long-term oncologic outcomes were analyzed using Cox proportional hazard models. P-values of ≤ 0.05 were considered statistically significant. The statistical analysis was performed using the R ver. 4.1.1 (R Foundation for Statistical Computing).
RESULTS
Correlation of demographic data and clinicopathological parameters with tumor regression grade
During the study period, a total of 580 patients with LARC were treated in our institute. Among these, 118 cases were treated with the nCRT, 14 cases were excluded. Finally, 104 LARC patients (61 males, 58.7%) were evaluated in this study (Fig. 1), with an overall mean age of 58.2 years. The most common cancer was lower rectal cancer in 55 patients (52.9%), followed by mid-rectal cancer in 40 (38.5%) and upper rectal cancer in 9 (8.7%). The median tumor distance from the anal verge was 5 cm. The median waiting interval between nCRT and surgery was 10 weeks. Regarding the 2 treatment regimens, 79 patients (76.0%) received 5FU/leucovorin and 25 (24.0%) received capecitabine. Sixty-eight patients (65.4%) underwent low anterior resection, and 36 (34.6%) underwent abdominoperineal resection (APR). The most common surgical approach was open surgery (60 patients, 57.7%). In total, 10 patients (9.6%) were classified as having TRG 1 or pCR, 22 (21.2%) as TRG 2, 26 (25.0%) as TRG 3, 46 (44.2%) as TRG 4, and none as TRG 5. The demographic and clinicopathological parameters and their correlations with TRG are shown in Tables 1 and 2.
The degree of tumor differentiation, absence of LVI, and interval between CRT and surgery differed significantly among the 5 TRG groups classified based on the 5-tier classification system. However, when TRG was divided into 2 groups, i.e., good response (TRG 1–2) and poor response (TRG 3–5), only the absence of LVI was significantly different between the groups. Further analysis revealed that the absence of LVI was strongly related to superior tumor response (odds ratio, 9; 95% CI, 1.99–40.69; P<0.001) (Table 3).
No associations of tumor regression grade with oncologic outcomes
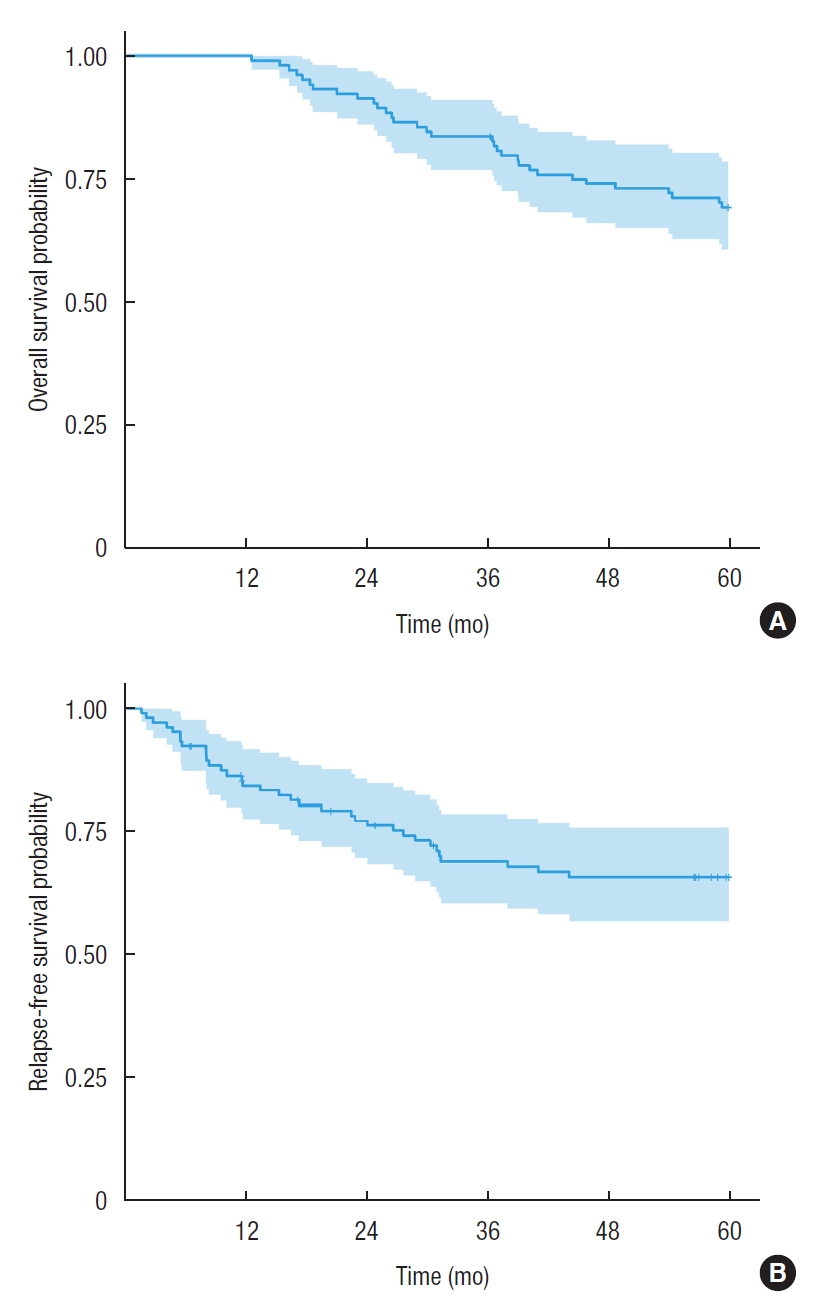
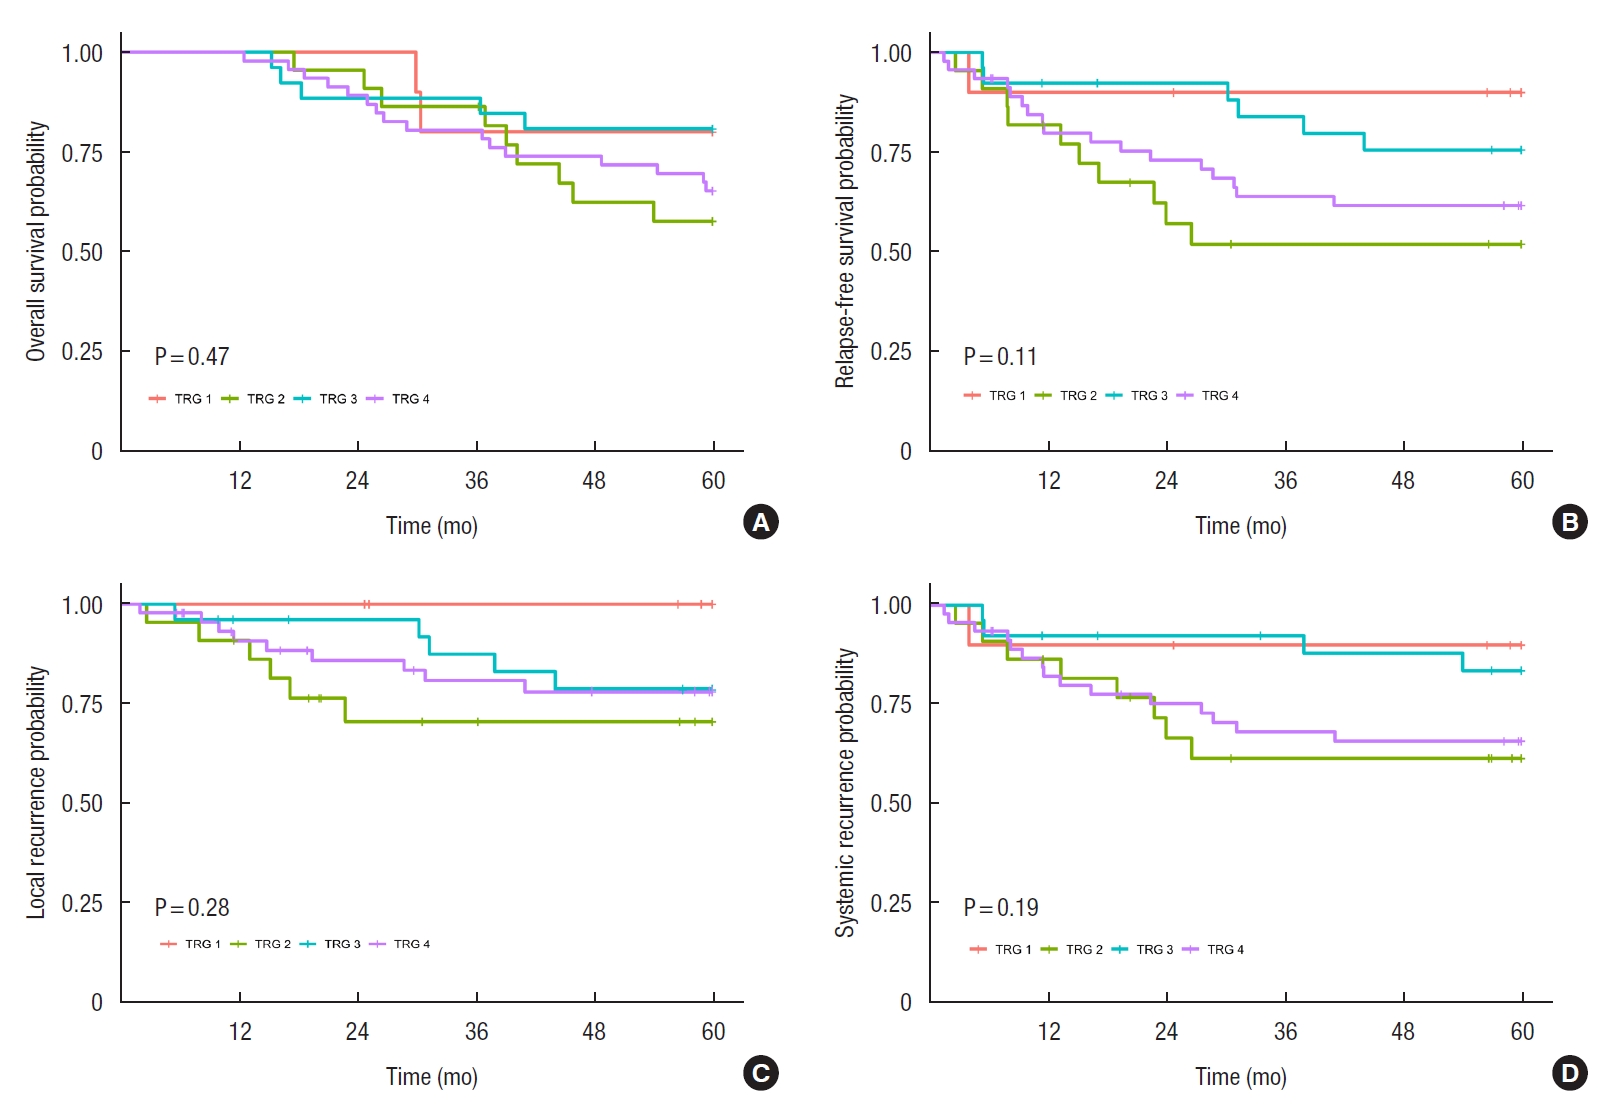
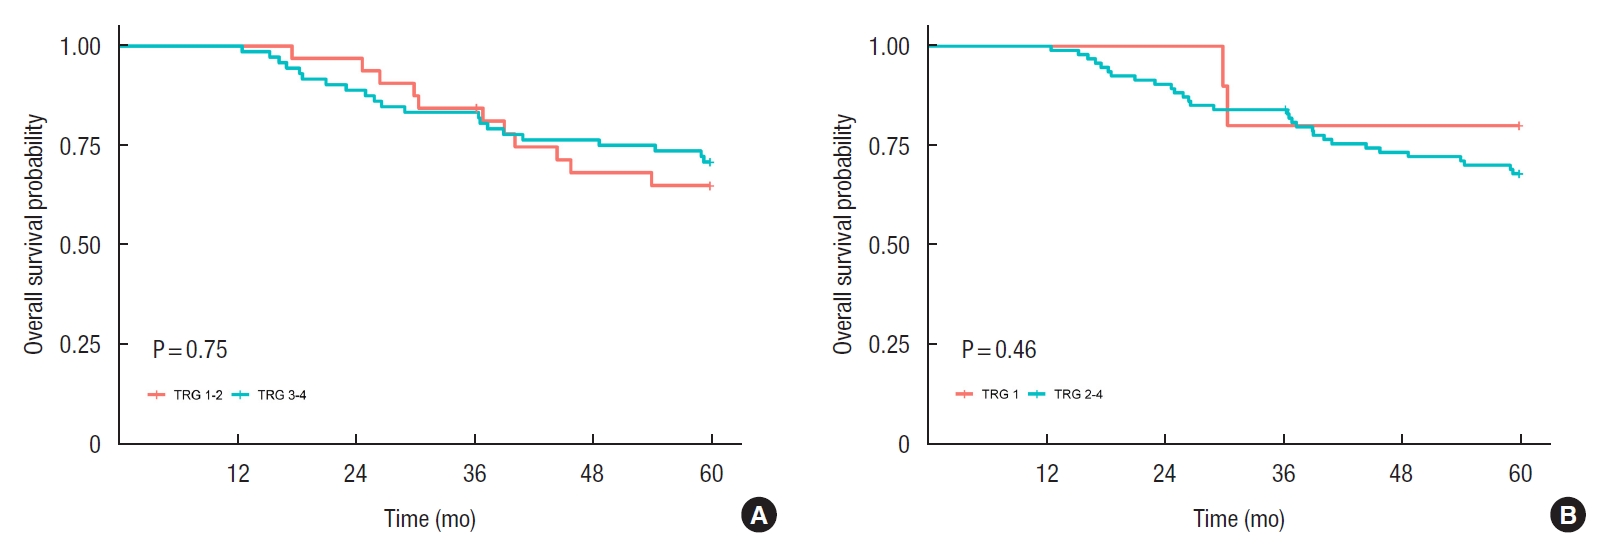
The 5-year OS and RFS in this study were 68.3% and 53.8%, respectively (Fig. 2). TRG was not associated with 5-year OS, 5-year RFS, or local or systemic recurrence (Fig. 3). When TRG was divided into the good and poor response groups, it was not found to be related to 5-year OS either (Fig. 4A). Moreover, pCR was not associated with 5-year OS (Fig. 4B).
Factors associated with oncologic outcomes
Five-year overall survival
Univariate analysis showed that the type of surgical procedure, intraoperative tumor perforation, tumor differentiation, presence of PNI, local recurrence, and systemic metastasis were significantly correlated with 5-year OS (Table 4).
Multivariate analysis showed that poor differentiation (hazard ratio [HR], 6.53; 95% CI, 2.13–20.00) and systemic metastasis (HR, 11.21; 95% CI, 4.35–28.9) were strongly associated with inferior 5-year OS (Fig. 5A). Only 25.0% of patients with poorly differentiated tumors (2 of 8) had survived for 5 years, whereas 66.7% with moderate differentiated tumors (16 of 24) and 75.0% with well differentiated tumors (54 of 72) had survived for 5 years after their cancer diagnosis. In addition, 17.9% of patients with metastases (5 of 28) had survived for 5 years, whereas 88.2% of those without metastases (67 of 76) had survived more than 5 years.
Five-year relapse-free survival
Multiple logistic regression analysis revealed that intraoperative tumor perforation (HR, 7.32; 95% CI, 2.63–20.40), poor differentiation (HR, 4.21; 95% CI, 1.35–13.20), and PNI (HR, 4.13; 95% CI, 4.13–13.60) were correlated with inferior 5-year RFS (Fig. 5B).
Unexpectedly, we found that 22.7% of TRG 2 cases (5 of 22) had poorly differentiated tumors, and this incidence was much higher than that reported for other TRG subclassifications. Poorly differentiated tumors were found in 0% of TRG 1 cases (0 of 10), 3.8% of TRG 3 cases (1 of 26), and 4.3% of TRG 4 cases (2 of 46). In addition, 45.5% of TRG 2 cases (10 of 22) had at least one poor prognostic factor (intraoperative tumor perforation, poor differentiation, or PNI).
DISCUSSION
This retrospective study assessed correlations between TRG and long-term oncologic outcomes in LARC after nCRT in 104 patients. The main findings of the study were as follows: (1) TRG was not associated with 5-year OS, 5-year RFS, or local or systemic recurrence; (2) an absence of LVI was related to good tumor response after nCRT; and (3) a poorly differentiated tumor and systemic recurrence, rather than TRG, were associated with inferior 5-year OS, and intraoperative tumor perforation, poor differentiation, and the presence of PNI were correlated with inferior 5-year RFS.
Several studies have reported correlations between TRG and OS and disease-free survival [15, 16]. However, other studies have found that TRG was not associated with 5-year OS or RFS [17], as demonstrated in the present study. Further, a previous study reported that TRG was related to oncologic outcomes based on univariate analyses, but it was not an independent factor associated with survival based on multivariate analyses [18]; several factors other than TRG, such as the patient’s age, tumor staging, or CRM, were related to survival [19]. There are many challenges in using TRG in clinical practice. First, TRG is classified based on various classification systems such as the American Joint Committee on Cancer, Mandard, Dworak, or Becker classifications; to date, there is no agreement on which of these systems is superior because different studies have reported inconsistent results [20, 21]. Second, TRG is indicated by the reporting pathologist; thus, the pathological report is subjective in nature with poor reproducibility and low inter-observer concordance rates. Third, TRG is mainly interpreted in terms of the primary tumor response, not in terms of the lymph node status; thus, it could underestimate the presence of a residual tumor in the lymph nodes. Notably, one study used a combination of TRG and pathological staging (ypTRG stage) to predict survival in rectal cancer patients who received nCRT and found that this combination was more accurate in predicting cancer prognosis [22]. Moreover, Park et al. [23] showed that an absence of LVI was significantly associated with good tumor response. Therefore, further studies are needed to identify useful predictive markers for survival in rectal cancer patients.
The present study found that a poorly differentiated tumor (HR, 6.53; 95% CI, 2.13–20.00) and systemic metastasis (HR, 11.21; 95% CI, 4.35–28.9) were independent factors strongly associated with 5-year OS; patients with poorly differentiated tumors had only a 5-year OS rate of 25%, whereas those with well- and moderately differentiated tumors had a 5-year OS of 72.9%. The finding is similar to that reported in a previous study by Huang et al. [24], which showed that patients with poorly differentiated tumors had a 3-year OS rate of 74.6%, whereas those with well differentiated tumors had a 3-year OS rate of 93.5%. Another study found that the HR of inferior OS for poorly differentiated adenocarcinoma was 3.43 [25]. Therefore, poorly differentiated rectal tumors have the worst prognosis, probably because of the aggressive nature of immature tumor cells. Indeed, poorly or dedifferentiated tumors have greater potential for epithelial to mesenchymal transition (EMT), an early step in systemic metastasis. EMT involves the loss of cell-to-cell adhesion, cytoskeletal reorganization, and changes from epithelial morphology and physiology to mesenchymal characteristics. Mesenchymal cell behavior can increase the capability of tumor cells to invade and migrate through the extracellular matrix [26], leading to an increased chance of distant metastasis [26, 27]. EMT is also related to resistance to treatment and the capability of tumor cells to escape the immune system [28]. Moreover, micrometastasis can occur at the time of LARC diagnosis, especially in poorly differentiated tumor cells [29], even in tumors responsive to chemoradiotherapy, in which clusters of viable, poorly differentiated tumor cells can repopulate and then spread into the blood circulation and cause distant organ metastasis. Additionally, tumor budding is a primordial step in cancer invasion and metastasis and has often been found coincidentally with poorly differentiated adenocarcinomas [30]. Tumor budding involves the detachment of tumor cells at the invasive front of rectal cancer into single cells or clusters of up to 5 cells and is also a characteristic of the EMT process. However, we did not identify any occurrences of this phenomenon in our study. Future studies are needed to clarify the clinical significance of tumor budding.
Regarding factors related to 5-year RFS, this study found that poor differentiation (HR, 4.21), intraoperative tumor perforation (HR, 7.32), and PNI (HR, 4.13) were associated with inferior RFS. Particularly, intraoperative tumor perforation was clearly associated with worse oncologic outcomes; this finding is similar to that reported in prior studies [31, 32]. Spilled tumor cells can regrow and recur and have a deleterious impact on survival. Most inadvertent perforations in this study were found in APR (7 of 9, 77.8%), and 55.6% (5 of 9) occurred in clinical T4 lesions. Notably, PNI, which has been defined as the ability of cancer cells to invade in, around, and through nerves, has also been demonstrated to be associated with diminished disease-free survival. Interactions between nerve and malignant tumor cells could enhance both neurogenesis and malignant cell growth. Indeed, some cellular and molecular mechanisms of tumor cells may promote neurotrophic factors, thereby leading to nerve cell growth and axon lengthening and thickening. In the same way, nerves provide a microenvironment that enhances tumor proliferation and progression [33]. Therefore, PNI is an ominous finding for various cancers [34]. In this era of precision medicine, further studies are needed to enhance our understanding of these factors for developing targeted treatments with an aim to improve the survival of cancer patients with PNI.
An unexpected finding in this study was that TRG 2 tumors had the worst oncologic outcomes: 22.7% of TRG 2 patients (5 of 22) had poorly differentiated tumors, with a rate much higher than that of other TRGs, and 45.5% of TRG 2 patients (10 of 22) had at least 1 poor prognostic factor (intraoperative tumor perforation, poor differentiation, or PNI). Thus, TRG 2 was confounded by other unfavorable prognostic factors, which led to a worse survival rate. These findings suggest that other factors, especially poorly differentiated cancers, were strongly associated with OS and that long-term oncologic outcomes were not influenced by the tumor response grade.
The limitations of this study were as follows. First, it was a retrospective study; there were difficulties in controlling for various confounding factors. Second, the sample size was small; therefore, the conclusions drawn from this need to be substantiated with larger studies. The advantage of this study was the relatively long-term follow-up. In conclusion, TRG was probably not associated with long-term oncologic outcomes, and the use of TRG to predict long-term oncologic outcomes had several limitations. Certain detrimental prognostic factors in cancer, such as poor differentiation, intraoperative tumor perforation, and PNI, were related to inferior survival outcomes.