


INTRODUCTION
Laparoscopic surgery for colon cancer has many demonstrated advantages over open surgery, including shorter hospital stay and earlier recovery of bowel function, with similar complication rates [1–3]. Laparoscopic bowel surgery is also as effective as open surgery in terms of oncologic results [2, 4–7]. With the development of this minimally invasive approach, intracorporeal anastomosis (IA) was introduced as an alternative to extracorporeal anastomosis (EA) to restore continuity of the colon after resection. Over the years, some studies have shown improved postoperative outcomes with IA as compared with EA with similar morbidity and mortality [8–12]. In a 2019 meta-analysis by Emile et al. [13], IA was associated with fewer complications and earlier recovery of bowel function with a lower incidence of incisional hernia. The aim of our study was to evaluate the influence of the technique used for anastomosis on intraoperative and postoperative outcomes of patients with laparoscopic surgery performed in a tertiary colorectal surgery center with an Enhanced Recovery After Surgery (ERAS) program.
METHODS
Ethics statements
The protocol of this study was approved by the Ethics Committee of the CHU de Québec – Université Laval. The requirement for informed consent was waived due to the retrospective design of the study.
Study design and patients
We conducted a retrospective cohort study of patients treated at our academic hospital from January 2015 to December 2019. Patient data was retrieved from our archive database using the code attributed to an elective laparoscopic right hemicolectomy. Surgeries were performed by 8 different fellowship-trained surgeons with expertise in minimally invasive surgery and/or colorectal surgery. Patients were included in the analysis if the surgical indication was a polyp or neoplasm of the caecum, appendix, ascending colon, or hepatic flexure confirmed on colonoscopy. Exclusion criteria were age of < 18 years, urgent or palliative surgery, multivisceral resection, metastatic disease or past medical history of ileocecal resection, transverse colectomy, or inflammatory bowel disease. Patients were also excluded if the lesion was located in the transverse colon. To study only patients who would have been eligible for either IA or EA, patients with conversion to open surgery were also excluded. Lengthening of the incision for specimen extraction was not considered a conversion, however.
Surgical technique
Patients were divided into 2 groups for analysis based on the type of anastomosis performed during laparoscopic hemicolectomy; the IA group and the EA group. The choice of anastomotic technique was at the surgeon’s discretion. It was mainly based on preoperative and intraoperative assessment of patient’s morphological characteristics and body mass index (BMI). Both hand-sewn and stapled bowel anastomoses were included when examining EA. Both intracorporeal and extracorporeal vessels ligation were performed, based on the surgeon’s preferences.
For patients in the IA group, stapled side-to-side anastomosis was performed. Whether an isoperistaltic or antiperistaltic anastomosis was performed was at the surgeon’s discretion. After division of the ileum and the mid-transverse colon using an EndoGIA 60 mm (Covidien), a traction point was placed on both bowels (Fig. 1). Enterotomies were created on the antimesenteric sides using electrocauterization. A common channel was obtained using an EndoGIA 60 mm. The common enterotomy was sutured intracorporeally using a continuous suture of Maxon 3-0 V-Loc (Covidien). The staple line was reinforced with seromuscular Vicryl 3-0 suture (Ethicon).
ERAS program
All patients included in this study were enrolled in our standardized ERAS protocol. No mechanical bowel preparation was used. Prophylactic intravenous antibiotics were given 30 to 60 minutes before surgical incision. Patients received subcutaneous heparin prophylaxis before induction. During surgery, an intravenous lidocaine protocol was used at the discretion of the anesthesiologist and was discontinued in the postanesthesia care unit (PACU). Restrictive use of intravenous fluid was applied. If patients had major risk factors for thrombosis, a sequential compression device was used. A perioperative urinary catheter and a warming blanket were routinely used.
An infusion of dextrose and NaCl with KCl was given postoperatively based on patient’s weight. On the day of surgery, a liquid nutritive diet was permitted. Early mobilization began 3 hours after PACU discharge criteria were met. Heparin prophylaxis was received at 10:00 PM the day of the surgery. On postoperative day (POD) 1, the urinary catheter and sequential compression device were removed at 6:00 AM. A regular diet was offered with snacks as needed. Intravenous fluids were discontinued if no vomiting was observed. A thromboprophylaxis regimen based on the patient’s weight was used. If not stated otherwise by the anesthesiologist, patient-controlled analgesia was discontinued. Oral acetaminophen (1 g, 4 times a day) with as needed doses of either morphine or hydromorphone were given. Anti-inflammatory drugs were used at the discretion of the surgeons. On POD 2, a regular diet was given. Patients were discharged if abdominal pain was controlled with oral medication, oral diet was well tolerated, and vital signs and blood work were within a normal range.
Follow-up was performed 4 to 6 weeks after surgery. For patients with a pathological diagnosis of cancer, a regular surveillance protocol was performed by the surgeon.
Study outcomes
The primary outcome was the incidence proportion of anastomotic leak at POD 30, which was defined as “a defect of the intestinal wall at the anastomotic site leading to a communication between the intraluminal and extraluminal compartments” detected either radiologically or intraoperatively [14]. Other anastomotic complications assessed as secondary outcomes, such as bleeding, stenosis, or intraabdominal abscess were also assessed 30 days after surgery.
Secondary perioperative outcomes were the time to first flatus and first bowel movement, nasogastric tube insertion, ileus (defined as time to the first passage of flatus ≥ 4 days), operative time, blood loss, perioperative blood transfusion, and length of stay. Early readmission and reoperation were evaluated at POD 30. Surgical site infection was assessed at POD 90. Finally, long-term secondary outcomes considered were the occurrence of incisional hernia, locoregional recurrence, or metastasis.
Data collection
Data was collected retrospectively from January 2015 to June 2020. Time to first flatus and first bowel movement were noted in the medical records, which included a sheet dedicated to collecting these data 3 times a day. Secondary perioperative outcomes were obtained through our data system. The incidence of anastomotic complications, locoregional recurrence, and distant metastasis was obtained via imaging studies reports, colonoscopy reports, and postoperative reoperation protocols. Surgical site infection was noted in follow-up records entered by the stoma nurse or the surgeon. Both postoperative clinical and radiological diagnoses of incisional hernia were considered.
Statistical analysis
The study population characteristics and outcomes are presented as proportions for categorical data and compared using the Fisher exact test. Continuous data are presented as mean with standard deviation and analyzed using a t-test procedure, or as median with interquartile range (IQR) and analyzed using a Mann-Whitney U-test when data were not normally distributed.
To address potential confounding factors for the long-term outcomes, incisional hernia and cancer recurrence were analyzed using a Cox regression. When appropriate, a hazard ratio (HR) was produced. Covariables with a P-value of ≤ 0.15 were included in the multivariate analysis through a stepwise selection process. The following variables were assessed for inclusion in the analysis for incisional hernia: anastomosis technique, type of extraction incision (midline vs. off-midline), age, sex, BMI, American Society of Anesthesiology (ASA) physical status (PS) classification, tobacco use, corticosteroid intake, history of abdominal hernia, diabetes, and surgical site infection. For cancer recurrence, the following variables were assessed: anastomosis technique, age, sex, BMI, ASA PS classification, anastomotic leak, anastomotic bleeding, pathological tumor stage, pathological nodal stage, tumor perforation, and lymphovascular, venous or perinervous invasion. Results were considered significant at P≤0.05. Analyses were performed using SAS University edition (SAS Institute Inc).
RESULTS
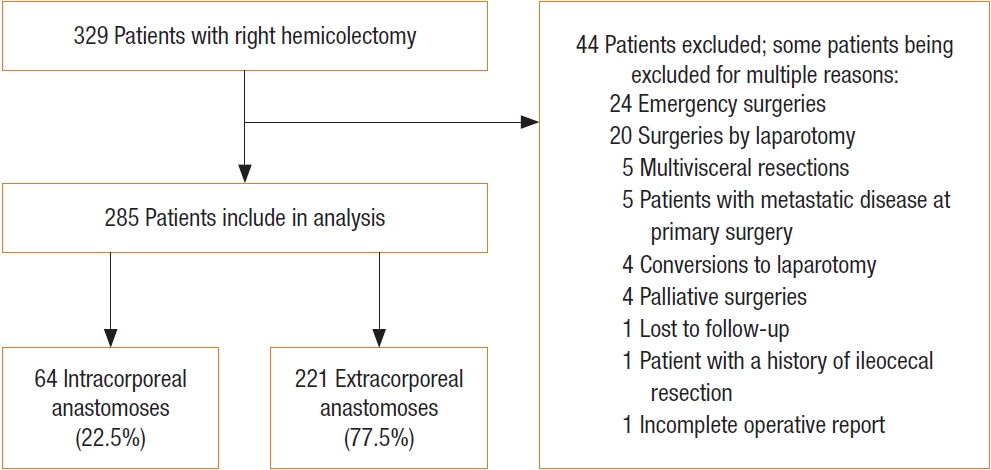
From 2015 to 2019, a total of 329 patients underwent right hemicolectomy and were assessed for eligibility. After the exclusion of 44 patients (Fig. 2), 285 patients were included in the study and were divided into study groups by the type of anastomosis performed; IA (64 patients, 22.5%) or EA (221 patients, 77.5%). The majority of the IA (58 of 64, 90.6%) was performed by 2 surgeons, with 48.3% of their anastomoses (58 of 120) being performed intracorporeally. For the remaining 6 surgeons included in this study, 96.4% of their anastomoses (159 of 165) were EA, with only 2 surgeons performing IA on 6 occasions. The groups were similar in terms of age, ASA PS classification, comorbidities, BMI, and sex (Table 1). There was a difference in the median duration of postoperative follow-up to data collection in June 2020 between the 2 study groups with a median follow-up of 30.3 months (IQR, 15.1–42.2 months) in the IA group vs. 37.7 months (IQR, 26.9–50.0 months) in the EA group (P<0.001).
Cancer was the most common surgical indication for laparoscopic hemicolectomy (Table 2). The majority of tumors in the IA group were located in the caecum (51.6% vs. 23.1%), while the majority of tumors in the EA group were located in the ascending colon (28.1% vs. 62.9%, P<0.01). There was no difference between the groups in pathological diagnosis; TNM stage; total ymph node count; positive lymph node count; or lymphovascular, venous, or perinervous invasion (Table 3). No positive margins were observed in this cohort.
In the EA group, 79 patients (35.7%) had a hand-sewn anastomosis and 142 patients (64.3%) had a stapled anastomosis. The type of incision used for tumor extraction also differed significantly between the 2 groups, as midline incisions were more commonly used with EA (IA, 3.1% vs. EA, 50.7%; P<0.001). In the IA group, 96.9% of incisions used for tumor extraction were either transverse or Pfannenstiel incisions (Table 2, Fig. 3).
There was no difference in the incidence proportion of anastomotic leak (IA, 0% vs. EA, 2.3%; P=0.59), bleeding (IA, 3.1% vs. EA, 2.7%; P>0.99) or intraabdominal abscess (IA, 0% vs. EA, 0.5%; P>0.99) at POD 30 (Table 4). No anastomotic strictures developed in the first 30 days postoperatively.
When we examined intraoperative outcomes (Table 4), IA was associated with a significantly longer operation (mean time of 160±31 minutes for IA vs. 138±42 minutes for EA, P<0.001). Because surgeon experience can affect operative time, we also considered a subgroup of patients cared for by the 2 surgeons who performed laparoscopic hemicolectomy with both IA and EA. The mean operative time was still significantly longer (157±28 minutes) in the patients with IA (n=58) than in the patients with EA (n=62; operative time, 142±40 minutes; P=0.02) constructed by these 2 surgeons. Additionally, no difference was noted in mean operative time when comparing their first and last 10 patients with an IA (the first 10 patients, 160±36 minutes vs. the last 10 patients, 164±21 minutes; P=0.78). In the larger cohort, there were no differences in operative blood loss (41±43 mL vs. 53±69 mL, P=0.09), the need for perioperative blood transfusion (1.6% vs. 0.9%, P=0.54), or intraoperative complications (4.7% vs. 8.6%, P=0.43) between patients with EA and patients with IA (Table 4).
Median time to first flatus was longer in the IA group (P=0.049), with a trend toward more ileus (17.2% vs. 9.0%, P=0.07). However, there was no difference in the incidence proportion of nasogastric tube insertion, median time to first bowel movement, or length of stay (Table 4). Only 8 patients were discharged before the recording of either a first flatus or first bowel movement.
At POD 30, there were no differences in the incidence proportion of surgical reintervention (P>0.99) or rehospitalization (P=0.55) between patients with IA and patients with EA. The incidence proportion of surgical site infection was similar between groups (P=0.38) at POD 90. At the end of follow-up, 26 patients had a diagnosis of incisional hernia (Table 4). The median time before diagnosis was 10.3 months (IQR, 6.9–13.4 months). The long-term incidence of incisional hernia was significantly lower in the IA group (1.6% vs. 11.3%, P=0.01). There was, however, no difference between groups for incisional hernia when stratified by the extraction site used for specimen removal (P=0.19) (Table 5). In multivariate analysis, a trend toward more hernia in the EA group was observed with an HR of 7.128 (95% confidence interval [CI], 0.956–53.165; P=0.06) (Table 6). BMI was the only other covariate included in the model (HR, 1.068; 95% CI, 0.991–1.151; P=0.08). There was no difference in the incidence proportion of incisional hernia repair (P=0.47).
The overall rate of recurrence was 10.8% (IA, 5.1%; EA, 12.4%; P =0.25) after a median follow-up of 3.0 years. In multivariate analysis, the type of anastomosis did not influence the recurrence rate (P=0.40) (Table 7). Local recurrence and systemic recurrence were similar in both groups. Most recurrences were systemic (94.7%), and the most common site of recurrence was the liver (57.9%).
DISCUSSION
In this retrospective study comparing intracorporeal and extracorporeal anastomoses during laparoscopic right hemicolectomy, there were no differences in anastomotic complications between the 2 approaches. Anastomotic leakage or bleeding and intraabdominal abscess were seen in only a few patients and with an incidence that was similar between the 2 approaches, which is consistent with previous studies [8, 9, 15–18]. No differences in intraoperative complications or blood loss were found between groups. However, an increase in operative time and time to first flatus was noted in patients with an IA. The need for surgical reintervention was equivalent between approaches, as well, with only 1% of patients requiring reoperation in the first 30 days after surgery in our cohort. IA was associated with a trend toward a reduction in incisional hernia. When performed routinely, both surgical techniques for anastomosis during laparoscopic hemicolectomy appear equivalent in terms of perioperative safety.
As observed in previous studies, the potentially longer operative time to create an IA has to be taken into consideration when choosing which technique to use [11, 16, 17, 19, 20]. Due to specific skills required to use mechanical linear staplers and place laparoscopic manual sutures, IA is often perceived as more technically challenging than EA [21]. This likely explains the difference in operative time observed in our study. The level of laparoscopic experience between surgeons did not seem to explain the difference in operative time, because the difference persisted when we did subgroup analysis of the operative times of surgeons performing both techniques often. Furthermore, the learning curve does not appear to be the cause of the increased operative time, because no difference was found in operative time between the first and last 10 patients with an IA in the subgroup analysis. The increased technical complexity of IA could potentially increase the risk of anastomotic complications. However, our study confirmed the safety of IA as compared with EA.
Previous studies and meta-analyses have shown a shorter time to first bowel movement [8, 10, 13, 17, 22], first flatus [10, 13, 15, 16], and a shorter length of stay [8–10, 13, 19, 20, 23] using the IA technique. An explanation proposed is that less mobilization and traction are required on the transverse colon and mesocolon, which would result in a faster recovery [8, 17]. However, these results contrast with our observations. The longer time to first flatus in our patients with IA may be partially explained by the longer operative time for this subgroup, which is a known risk factor for a slower bowel recovery [24]. A recent study by Trépanier et al. [25] that found IA was not associated with faster gastrointestinal recovery for surgeries performed with an ERAS program could also partially explain our results. Indeed, because return of bowel function and duration of hospitalization are already significantly improved with implementation of the ERAS protocols, the impact of the choice of anastomosis might be tempered. Both the IA patients and the EA patients in our study had a median length of stay of 4 days, which is lower than previously published data [13, 15, 17, 19, 20]. Even though time to first flatus was significantly longer in our IA group with a trend toward more ileus, time to first bowel movement, length of stay, and use of a nasogastric tube were similar in both groups. Therefore, the clinical impact of the anastomotic technique used during laparoscopic hemicolectomy on perioperative evolution and hospitalization seems to be negligible.
In the meta-analysis by Emile et al. [13] published in 2019, EA was associated with higher odds of incisional hernia. In our cohort, there was also a significantly higher incidence proportion of incisional hernia in the EA group at the end of the follow-up period. This difference might be partially explained by the median length of postoperative follow-up until data was collected in June 2020, which was shorter in the IA group. However, in our multivariate analysis, which included the incidence rate of hernia, IA was still associated with a strong trend toward a reduction in incisional hernia incidence. Due to the retrospective aspect of this analysis, data on incision length and incision lengthening was not readily available. However, as previously stated in other studies [8, 11, 16, 17, 26], we assume that the incisions for specimen extraction in patients with IA were smaller than the incisions in patients with EA. Therefore, the decrease in incisional hernia incidence seen with IA might also be explained by the anastomotic technique itself. Additionally, the type of incision used for specimen extraction was significantly different between our EA and IA groups, with more midline incisions in the patients with EA. Patients with midline incisions have a higher risk of incisional hernia [27]. This variable was not included in the stepwise regression of the multivariate analysis, however, due to a lack of statistical significance. Nonetheless, the avoidance of a midline incision could be an argument in favor of IA given the similarities in early postoperative evolution and postoperative safety between EA and IA in this study.
Finally, it has been suggested that IA might result in better oncological outcomes by allowing a higher vascular ligation. However, similar to previously published data, we did not observe any differences in recurrence or lymph node count according to the type of anastomosis created. [8, 15, 16, 18, 23, 28]. Our overall incidence proportion of recurrence of 10.8% at a median follow-up of 3.0 years was similar to previous reports. Augestad et al. [29], for instance, reported an 11.2% recurrence rate with median surveillance of 36 months in 3,870 patients with right-sided adenocarcinoma.
This study has some limitations. The retrospective nature is one limitation and may have introduced a potential selection bias, as the choice of anastomosis technique was left to the surgeons. The study groups were quite similar, however, in most oncologic parameters. Although the location of the resected lesion differed significantly between the IA and EA groups, an impact on each patient’s postoperative evolution is unlikely. Due to this retrospective design, no standardization was possible for the surgical technique. The approach for vessels ligation was therefore variable among surgeons for EA, as both intracorporeal and extracorporeal vessels ligation were included in this study. This could have influenced the length of the extraction excision required, which was also not standardized and recorded, therefore potentially influencing the occurrence of incisional hernia. Another limitation was that the incidence of incisional hernia was retrospectively evaluated with medical records and radiological studies. Prospective evaluation of patients with physical examination and systematic radiological assessment for benign disease would have improved the diagnosis of incisional hernia. The majority of IA were performed by only 2 surgeons, which can have introduced a certain heterogeneity in postoperative evolution. Finally, surgeries were performed in a single referral center for minimally invasive colorectal surgery. The validity of the findings to other centers will need to be tested, as a higher volume of a specific technique has been associated with fewer complications [30].
For laparoscopic right hemicolectomy, both the surgical techniques of IA and EA are safe, with a low incidence of anastomotic complications when performed by experienced surgeons. IA may be associated with a lower incidence of incisional hernia.