


INTRODUCTION
The laparoscopic colectomy is being performed with increasing frequency worldwide. Several randomized clinical trials have confirmed that a laparoscopic colectomy for the treatment of patients with colon cancer is safe and has better results compared to open surgery. The advantages of a laparoscopic colectomy over open surgery are less postoperative pain, shorter hospital stays, and better cosmesis, while achieving similar long-term results [1-3]. Thus, the laparoscopic colectomy has been accepted as a standard procedure in colorectal surgery.
In the field of colorectal surgery, multiport laparoscopic surgery (MPLS) is as widely accepted as conventional laparoscopic surgery. Since the acceptance of laparoscopic colectomy as the preferred approach, surgeons and industry sponsors have explored options to lessen the trauma associated with the traditional multiport approach by reducing port size and, more recently, introducing single-incision laparoscopic surgery (SILS). In order to reduce surgical invasiveness and improve cosmesis, surgeons skilled in conventional laparoscopic and endoscopic surgery have recently developed more advanced SILS techniques, as well as natural orifice transluminal endoscopic surgery (NOTES). SILS is a feasible procedure for several abdominal operations, such as a cholecystectomy [4, 5], an appendectomy [6], urologic surgery [7], and a colectomy [8]. However, SILS requires a long operating time, experienced surgeons, and advanced surgical techniques due to technical difficulties, including the overlap of laparoscopic instruments and the limitation of triangular tissue traction [9, 10].
Creating an appropriate operative field is important because colorectal surgery is a plane-based procedure. Triangulation produced by traction and countertraction is the basis for establishing adequate visualization in all stage of the procedure. Therefore, we attempted 3-port laparoscopic surgery with 1 surgeon and 1 camera operator. The present study aimed to compare the perioperative clinical outcomes of reduced-port laparoscopic surgery (RPLS) with those of conventional MPLS for patients with sigmoid colon cancer and to investigate the safety and feasibility of RPLS performed by 1 surgeon and 1 camera operator.
METHODS
Patients
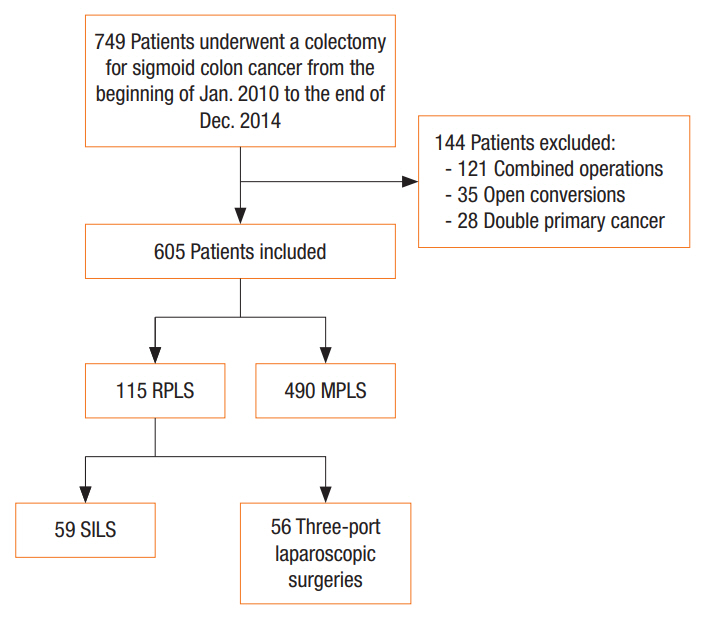
The prospectively collected data on 749 consecutive patients with sigmoid colon cancer who underwent a minimally invasive colectomy at the National Cancer Center (NCC) from the beginning of January 2010 to the end of December 2014 were retrospectively reviewed. We excluded 144 patients: 121 with combined operations, 35 with open conversions and 28 with double primary cancer; some patients were in multiple categories. The remaining 605 patients were enrolled in the study. This study was approved by the Institutional Ethnics Review Board of the National Cancer Center (NCC2017-0001). Informed consent of the patients is not required for this type of study.
MPLS with 4 to 5 ports to complete the operation was performed on 490 patients. Application of RPLS was determined by the preference of each surgeon according to tumor size and status of the lymph nodes on preoperative imaging. Accordingly, 115 patients underwent RPLS, including 59 patients who underwent SILS and 56 who underwent 3-port laparoscopic surgery (Fig. 1). The SILS group also contained 5 SILS+1 cases, each of which required one additional port. All operations were carried out at the NCC.
Patients’ demographic characteristics and perioperative variables, operative time, estimated blood loss, tumor size, lengths of proximal and distal resection margins, length of incision, number of harvested lymph nodes, and number of positive lymph nodes, were evaluated. The patient’s general preoperative status was assessed using the American Society of Anesthesiology (ASA) physical status classification system. The operation time was calculated as the time from first incision to wound closure. The short-term surgical outcomes included severity of postoperative pain, time to first flatus and bowel movement, length of hospital stay, and postoperative complications. The pain score was assessed using a visual analogue scale (VAS) on the first postoperative day. Postoperative complications were classified according to the Clavien-Dindo Classification [11].
Surgical techniques
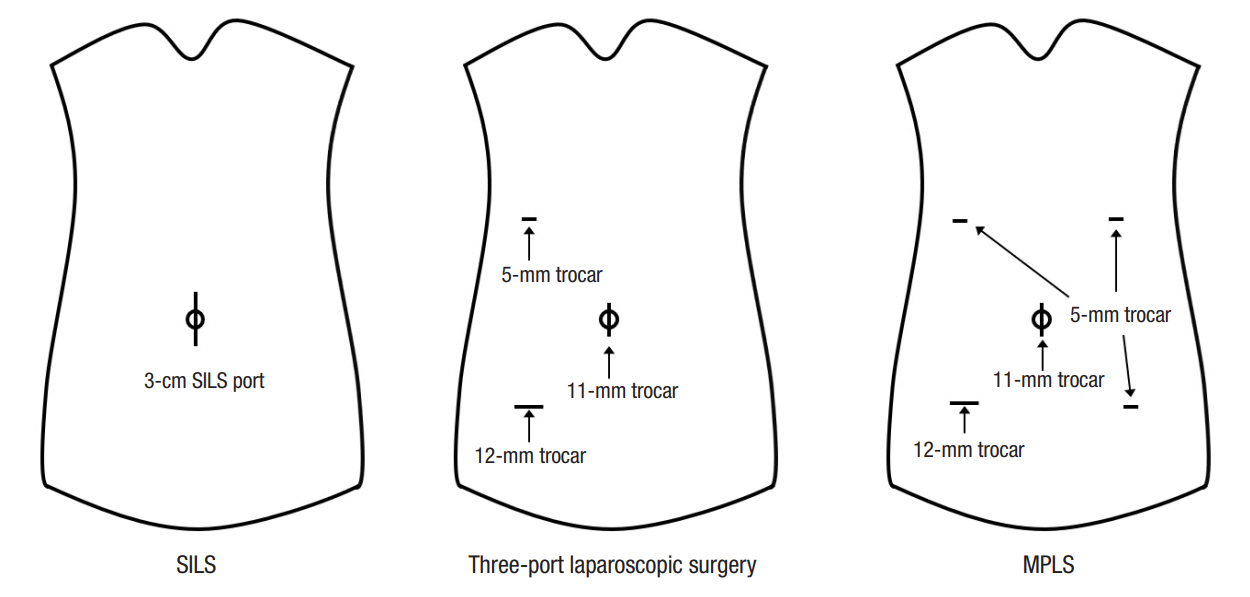
The surgeries included were an anterior rectosigmoidectomy, low anterior resection, or left hemicolectomy. We defined RPLS as including SILS and 3-port surgery. In SILS, a vertical 3-cm incision was made in the umbilicus and a SILS port (Covidien, Norwalk, CT, USA) was placed at the site. The procedure was performed using a surgical technique similar to standard laparoscopy, with traditional laparoscopic instruments, except that it was conducted through a single transumbilical port. In the 3-port surgery, the first 11-mm port for the scope was inserted at the umbilicus. An additional 12-mm port was inserted in the right lower abdomen, and a 5-mm port was inserted in the right upper abdomen (Fig. 2). In MPLS, 1 or 2 additional ports, which were manipulated by the assistant surgeon, were inserted as needed. After the umbilical and additional ports had been inserted, the operating table was placed in the Trendelenburg position and tilted to the side opposite the tumor. Laparoscopic electrocautery was used to dissect the peritoneum beginning at the root of the mesocolon while preserving the posterior mesocolic fascia, with mobilization of the colon from the medial to the lateral side. A vessel-sealing device or clip was used to ligate the main supply vessels. The left gonadal vessels and ureter were preserved. After the left colon had been retracted to the right side, the remaining lateral peritoneal attachments were divided. The umbilical incision or right lower abdomen port site was extended for specimen extraction. The anastomosis was performed using a circular stapler. Finally, a drainage tube was placed in the pelvic space through a port site.
Statistical analysis
Statistical analysis was performed using SPSS ver. 14.0 (SPSS Inc., Chicago, IL, USA). The Student t-test and Mann-Whitney test were used to compare continuous variables between the 2 groups for each parametric and nonparametric variable. Categorical data were expressed as percentages and were compared using the chi-square test or Fisher exact test. We considered a P-value of 0.05 or less to be statistically significant.
RESULTS
During the study period, of the 605 included patients, 115 (19.0%) with sigmoid colon cancer underwent treatment with RPLS and 490 (81%) underwent treatment with MPLS. Of the 115 patients that underwent RPLS, 59 underwent SILS and 56 underwent 3-port laparoscopic surgery. The demographic characteristics of the patients in the 2 groups, RPLS and MPLS, are shown in Table 1. No statistically significant differences were observed according to mean age, sex, mean body mass index, ASA physical status classification, history of abdominal operations, or preoperative carcinoembryonic antigen concentration between the 2 groups.
Table 2 presents the perioperative results for the RPLS and the MPLS groups. No differences in estimated blood loss volume, tumor size, proximal resection margin, number of harvested lymph nodes or number of positive lymph nodes were found. The mean distal resection margins in the RPLS and the MPLS groups were 4.4 ± 2.3 and 5.4 ± 3.5 cm, respectively (P = 0.001), and the mean lengths of incision were 5.3 ± 2.2 and 7.8 ± 1.2 cm, respectively (P < 0.001). The operating times were significantly shorter in the RPLS group than in the MPLS group (P < 0.001). Additionally, all pathological data were similar between the 2 groups (Table 3).
The patients’ short-term outcomes are presented in Table 4. The VAS scores on the first postoperative day were not significantly different between the groups. The time to first flatus (2.6 days for the RPLS group vs. 2.4 days for the MPLS group) and the length of postoperative stay (9.1 days for the RPLS group vs. 8.8 days for the MPLS group) were similar for the 2 groups. No difference in complication grade was noted between these 2 groups.
In the subgroup analysis of the RPLS group, we compared the clinical outcomes of SILS and 3-port laparoscopic surgery. The demographic data of these 2 groups are shown in Table 1. The patients in the SILS group were younger than those in the 3-port laparoscopic surgery group (P = 0.007). Table 2 presents the perioperative results for these 2 groups. The operating times were significantly shorter in the 3-port laparoscopic surgery group than in the SILS group (P = 0.001). The size of the tumor was significantly larger in the 3-port laparoscopic surgery group (P = 0.037), and the length of incision was significantly shorter in the SILS group (P < 0.001). Table 3 presents the pathologic data for these 2 groups. The 3-port surgery group correlated to more advanced T stage (P < 0.001) and more lymphatic invasion (P = 0.014). No significant differences in short-term outcomes, including maximal VAS pain scores, time to first flatus, length of hospital stay, or postoperative complications, were observed between these 2 groups (Table 4).
DISCUSSION
Our results support the evidence that surgery for sigmoid colon cancer can be performed using RPLS without compromise to the early surgical outcome. RPLS for the treatment of patients with sigmoid colon cancer may confer additional advantages, such as reduced operating time and length of incision, over conventional multiport surgery.
Conventional laparoscopic surgery is usually performed using 4 or 5 ports, and one of the port sites is extended by 4 to 6 cm for specimen extraction. An assistant plays an important role in making an accurate dissection plane with traction and countertraction during surgery. However, the conventional 5-port technique has some disadvantages. Because the camera view for the assistant is a mirror image, the movements of instruments can confuse the assistant and may cause involuntary injuries while handling tissues.
SILS is a simple extension of conventional laparoscopic surgery and, unlike NOTES and robotic surgery, does not require new instruments. In addition, it can produce better cosmetic results than a conventional laparoscopic colectomy [12]. However, SILS has not been widely adopted as a surgical option for a colectomy due to the limitations of triangular traction and instrument movement [9, 10]. Therefore, SILS requires an experienced surgeon to overcome the technical difficulties of triangular tissue traction, pneumoperitoneum leakage, and overlapping instruments [13].
In an attempt to overcome the difficulties of SILS, we performed a 3-port technique that combined some advantages of conventional laparoscopy and SILS as a way to improve reduced-port surgery for patients with colorectal cancer. The surgeon was on the right when mobilizing and dissecting the left colon, and the camera operator was to the left side of the surgeon during surgery. In most cases, dissection and mobilization were performed from the medial side to the lateral side. In our study, all the surgical procedures were performed in a similar fashion to a conventional laparoscopic colectomy. The resection margins were all clear, and both the mean distances of the proximal and the distal margins and the median number of harvested lymph nodes were acceptable. Compared with MPLS, the postoperative complications of SILS, such as bleeding, leakage, and stricture of the anastomosis site, were comparable.
The surgical technique with one surgeon using three ports and one camera operator has several advantages. As in previous studies, minimizing the number of ports can reduce procedural invasiveness [14, 15]. The entire procedure is coordinated by the primary surgeon, thus avoiding dangerous situations caused by unskilled assistants. Removing the 2 trocars as working ports for the assistant can minimize the postoperative risk of morbidity, such as bleeding, infections, and hernia formation at the trocar sites [16, 17]. Decreasing intraoperative trauma and visible scarring during surgery increases patient satisfaction.
In this study, we examined the technical feasibility of RPLS, including 3-port laparoscopic surgery and SILS, in terms of its short-term surgical outcome. The surgical outcome of RPLS was comparable to that of a conventional laparoscopic colectomy except for its operative time, which was paradoxically shorter, indicating that the surgeon’s expertise might have greater influence on the duration of the surgery than the number of ports. Our institute has identified the learning curves for a laparoscopic sigmoidectomy from the experiences of three surgeons. Through that study, learning curves generated using a cumulative sum analysis based on a 90% success rate showed that adequate learning occurred after 10 cases for surgeon A, 17 cases for surgeon B, and 5 cases for surgeon C. The moving average learning curves for all 3 surgeons showed that the operation time gradually decreased with increasing experience, ultimately reaching a steady state after approximately 42 procedures for surgeon A, 35 for surgeon B, and 30 for surgeon C [18]. All surgeons that participated in this study had performed sufficient surgery beyond the learning curve. The results of this study indicate that RPLS is technically feasible when appropriate surgical techniques are applied and the patients are selected appropriately.
In subgroup analyses of the RPLS group, the operating times were significantly shorter in the 3-port laparoscopic surgery group than the SILS group, despite the member of the former group being older and having larger tumor size, more advanced T-stage and more lymphatic invasions. This result may be due to the better operation field, which facilitates better movements of the instruments in 3-port laparoscopic surgery than in SILS. Additionally, no significant differences in short-term outcomes were found between the 2 groups. Based on the subgroup analyses, we suggest that 3-port laparoscopic surgery is better than SILS in several aspects.
The actual difference between MPLS and RPLS is only one or two 5-mm ports, so we can conclude that the benefits of RPLS for surgical invasiveness are subtle. However, a significant difference between the 2 procedures is that 2 surgeons are required to perform MPLS versus one surgeon to perform RPLS. Usually, MPLS is performed by 1 surgeon, 1 assistant surgeon, and 1 camera operator, so 2 surgeons are required. In contrast, only 1 surgeon is required for performing RPLS. Therefore, we conclude that RPLS will play a substantial role in 1-surgeon laparoscopic colectomies.
The limitations of our study should be pointed out. First, all the operations considered in this study were conducted by 6 surgeons, but the results did not reflect the differences among the surgeons by experience or capability. Although such differences were not considered, we assumed that this would not affect the results because the lesions were confined to the colon, so the procedure was generalized, and all surgeons involved in this study had sufficient experience. Second, the effect of the camera operator’s ability on the surgical outcome was not evaluated. Thus, further study should be conducted on the impact of the experience of the surgeon and that of the camera operator on the surgery. Third, the criteria for performing a surgical procedure for each group were arbitrary. Application of RPLS was determined by surgeon’s preference based on tumor size and status of the lymph nodes on preoperative imaging. No significant differences in demographic characteristics of the patients between the MPLS and the RPLS groups were observed. In contrast, a comparison of the SILS group with the 3-port surgery group showed that the patients in the SILS group tended to be younger and to have less advanced cancers. Additionally, the present study was designed to assess the short-term outcomes and surgical quality after tailored laparoscopic approaches and was carried out at a single institution. Furthermore, it was retrospective in nature, and the inclusion criteria resulted in a population of selected patients. Therefore, a larger prospective study of the short- and the long-term outcomes of RPLS and MPLS is needed to demonstrate the benefits of RPLS over MPLS.
In conclusion, the results of this study provide further evidence supporting the feasibility of RPLS for the treatment of patients with sigmoid colon cancer. We have demonstrated that RPLS, including reduced- or single-port laparoscopy, without assistant surgeons appears to be feasible and safe. No significant differences in the perioperative results, pathological data, or postoperative surgical outcomes were observed between the reduced-port group and the conventional groups. In addition, the subgroup analyses demonstrated that SILS could be applied to patients with favorable tumor characteristics.