Ann Coloproctol Search

CLOSE


Kim, Jeong, Park, Ryoo, Cho, Lee, and Park: Oncologic Outcomes in Patients Who Undergo Neoadjuvant Chemoradiotherapy and Total Mesorectal Excision for Locally Advanced Rectal Cancer: A 14-Year Experience in a Single Institution

Abstract

Purpose

This study evaluated the oncologic outcomes of locally advanced rectal cancer patients who underwent preoperative neoadjuvant chemoradiotherapy (CRT) followed by surgery and determined the prognostic significance of pathologic complete response (pCR).

Methods

Between January 2002 and December 2015, 580 patients with rectal cancer who underwent surgery after neoadjuvant CRT were identified. Survival according to tumor response to CRT and pathologic stage was analyzed using the Kaplan-Meier method, and the Cox proportional hazard model was used to identify factors associated with survival outcomes.

Results

A total of 111 patients (23.7%) achieved pCR while the other 469 patients showed residual disease. Patients with pCR had a lower pretreatment carcinoembryonic antigen level and earlier cT classification than those with residual disease. With a median follow-up of 78 months, disease-free survival (DFS) and overall survival (OS) were significantly better in the pCR group than in the residual disease group. The 5-year DFS and 5-year OS for patients with ypStage 0, I, II, or III were 92.5%, 85.1%, 72.2%, 54.3% (P < 0.001) and 94.5%, 91.0%, 83.1%, 69.3%, respectively (P < 0.001). Pathologic AJCC stage after CRT was the most statistically significant independent predictor of OS (HR, 6.97 [95% confidence interval, 3.16–15.39] for stage III vs. stage 0) and DFS (HR, 7.30 [95% confidence interval, 3.63–14.67] for stage III vs. stage 0).

Conclusion

Rectal cancer patients who achieved pCR showed improved survival compared to those with residual disease after preoperative CRT. Moreover, pCR was an independent indicator of OS and DFS, and pathologic AJCC stage was correlated with survival after preoperative CRT.

INTRODUCTION

Colorectal cancer is the second most commonly diagnosed cancer in Korea, and about 8,500 patients die of colorectal cancer every year [1]. According to global cancer statistics from 2018, Korea is one of the countries with the highest incidence of colorectal cancer, and men in Korea have among the highest rates of rectal cancer [2].
For locally advanced rectal cancer, neoadjuvant chemoradiotherapy (CRT) followed by surgery is the mainstay of treatment [3]. Neoadjuvant CRT results in better survival and reduced pelvic local recurrence in rectal cancer patients. Even in the era of total mesorectal excision, compared to surgery only, radiotherapy plus surgery reduced the 10-year cumulative incidence of local recurrence from 11% to 5%, and improved the 10-year survival by 10% in stage III cancer patients with a negative circumferential resection margin [4]. Furthermore, preoperative CRT was shown to be superior to postoperative CRT with regard to local control, compliance, and toxicity in a German randomized trial [5, 6].
Preoperative long-course CRT reduces primary tumor volume and eradicates metastases in some lymph nodes in some groups of patients [7]. However, the tumor response to the treatment varies even in evenly distributed cT2–3 or node positive patients indicated for preoperative CRT; while patients may experience disease progression; 10% to 30% of patients show pathologic complete response (pCR), defined as the absence of viable tumor cells in surgical specimens. The degree of tumor downstaging after neoadjuvant CRT is associated with patient prognosis [8] and the disease-free survival of patients such that each downstaged post-CRT stage is similar to the respective pathologic stage [9].
Based on tumor response to CRT, the treatment strategy can be revised for better outcomes. In the case of pCR, patients could be managed nonoperatively (“watch and wait”) without compromising survival outcomes [10, 11]. Thus, identifying the oncologic outcomes of patients undergoing preoperative CRT and surgery stratified according to treatment response can be clinically useful for determining patient prognosis and planning further treatment. However, there is a lack of pertinent data to determine preoperative CRT outcomes in rectal cancer patients because few studies with a large number of rectal cancer patients and with a long term follow-up have been conducted. In this study, we evaluated oncogenic outcomes of patients with locally advanced rectal cancer who underwent surgery after neoadjuvant CRT in a large-volume single institution and who were followed for 14 years.

METHODS

Study design

This study was a retrospective study based on prospectively collected registry data. The registry we used contains data of all patients who undergo surgery at our institution (Seoul National University Hospital). The database has been maintained since January 2002. This study was approved by the Institutional Review Board of Seoul National University Hospital (approval number: SNU1903-077-1017). Informed consent was waived according to board regulations for retrospective studies.

Setting

All study patients underwent preoperative concurrent CRT for rectal cancer. The indication for preoperative CRT was locally advanced tumor invasion (cT3–4) or a clinically positive lymph node with cT2 tumor. Preoperative CRT was performed as described previously [12]. For initial radiotherapy, radiation was given in 25 fractions of 1.8 Gy for a planning target volume for large field. The supplemental booster dose consisted of 3 to 6 fractions of 1.8 Gy to cover the planning target volume for reduced field. A booster dose beyond 5.4 Gy was administered to patients with cT4 or limited mobility on physical examination midway through preoperative treatment.
Surgery was performed 6 to 8 weeks after completion of neoadjuvant CRT. Proctectomy was performed according to the total mesorectal excision principle. The type of surgery and the surgical approach were determined was based on the surgeon’s preference.
In general, the decision to perform adjuvant chemotherapy was based on treatment guidelines, but the decision was modified according to each patient’s general condition and the physician’s preferences.

Participants

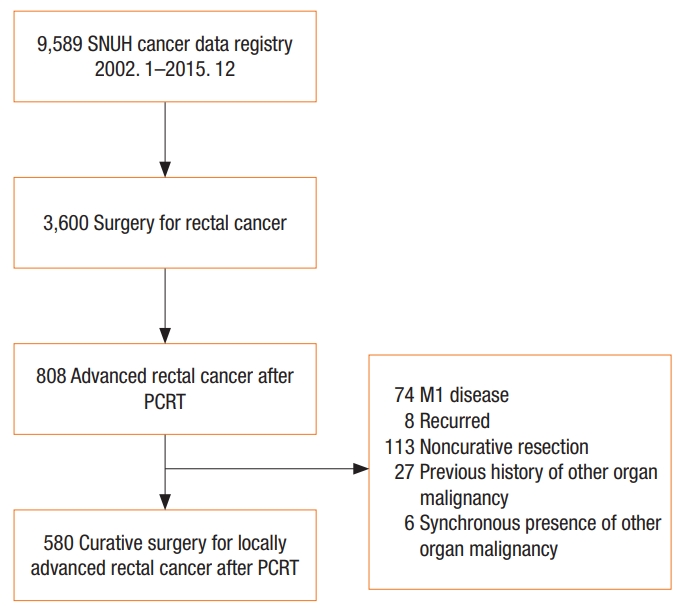
Between January 2002 and December 2015, 3,600 patients underwent surgery for rectal cancer at Seoul National University Hospital; of them, patients with locally advanced rectal cancer who received neoadjuvant CRT with curative resection were selected (Fig. 1). We excluded patients with metastasis or disease recurrence, those with noncurative resection, and those with a previous history of other organ malignancy or synchronicity with other organ malignancy.

Variables

We collected data on patient demographics, tumor characteristics, surgical aspects, and pathologic outcomes. pCR was defined as ypT0N0M0. Patients were divided into 2 groups according to tumor response to preoperative CRT (pCR vs. residual disease). Collected variables and survival outcomes were compared between these 2 groups.
Disease-free survival (DFS) and overall survival (OS) were analyzed in all study patients according to ypT classification, ypN classification, and the American Joint Committee on Cancer (AJCC) stage. Variables included in the univariable analyses were age, sex, American Society of Anesthesiologists physical status (ASA PS) classification, pretreatment carcinoembryonic antigen (CEA) level, tumor location, operative type, circumferential resection margin status, AJCC stage, ypT classification, ypN classification, and postoperative chemotherapy status. Variables that had significant associations in the univariable analysis were entered into the multivariable analysis. Because AJCC stage, ypT classification, and ypN classification are potential confounders, we analyzed each of these three variables one by one in multivariable analysis.

Statistical analysis

Categorical variables were compared using the chi-square test or Fisher exact test and continuous variables were compared using Student t-test or the Mann-Whitney U-test. Continuous variables are presented as means ± standard deviations or medians (range), according to the normality of distributions, while categorical variables are presented as frequencies (percentages).
DFS and OS were defined as the time from surgery to any recurrence or death and as the time from surgery to death, respectively. Kaplan-Meier analysis was used to estimate survival rates and visualize survival curves, and the log-rank test was used to compare survival curves among groups. Cox proportional hazard ratios were determined to identify factors associated with OS and DFS. A P-value less than 0.05 was considered statistically significant.
All statistical analyses were performed using IBM SPSS Statistics ver. 25.0 (IBM Co., Armonk, NY, USA).

RESULTS

Patient and tumor characteristics

Between January 2002 and December 2015, 580 patients underwent curative intent surgery for locally advanced rectal cancer after neoadjuvant CRT. pCR (ypT0N0) was achieved in 111 patients (23.7%), while the other 469 patients showed residual disease on pathologic evaluation.
Characteristics of patients in the 2 groups are shown in Table 1. The number of patients with advanced clinical T classification before neoadjuvant CRT was significantly higher in the residual disease group than in the pCR group. Moreover, patients with residual disease had higher pretreatment CEA levels than those with pCA (2.5 vs. 2.0, P = 0.01). CEA level after neoadjuvant CRT and differences in CEA levels before and after CRT were not significantly different between the 2 groups. Number of patients who received postoperative chemotherapy was significantly higher in the residual disease group than in the pCR group (83.1% vs. 63.1%, P < 0.001). No significant differences were observed in age, sex, body mass index, ASA PS classification, or underlying disease between the 2 groups.

Operative and pathologic outcomes

The sphincter was saved in 91.7% of patients with pCR and 91.9% of patients with residual disease (P = nonsignificant) (Table 2). Open proctectomy was performed in 73.3% of all patients, and 25.2% and 1.6% of patients underwent laparoscopic and robotic surgery, respectively. Operative time and length of postoperative hospital stay were not significantly different between the pCR and residual disease groups. Pathologic AJCC stage and tumor and nodal classification for both groups are presented in Table 2. Four of 111 patients (3.5%) had no residual disease in the location of the primary tumor, but had metastatic nodal disease (ypT0N+). Of 151 ypT0-1 patients, 11 patients (7.3%) had pN1 disease.

Survival outcomes

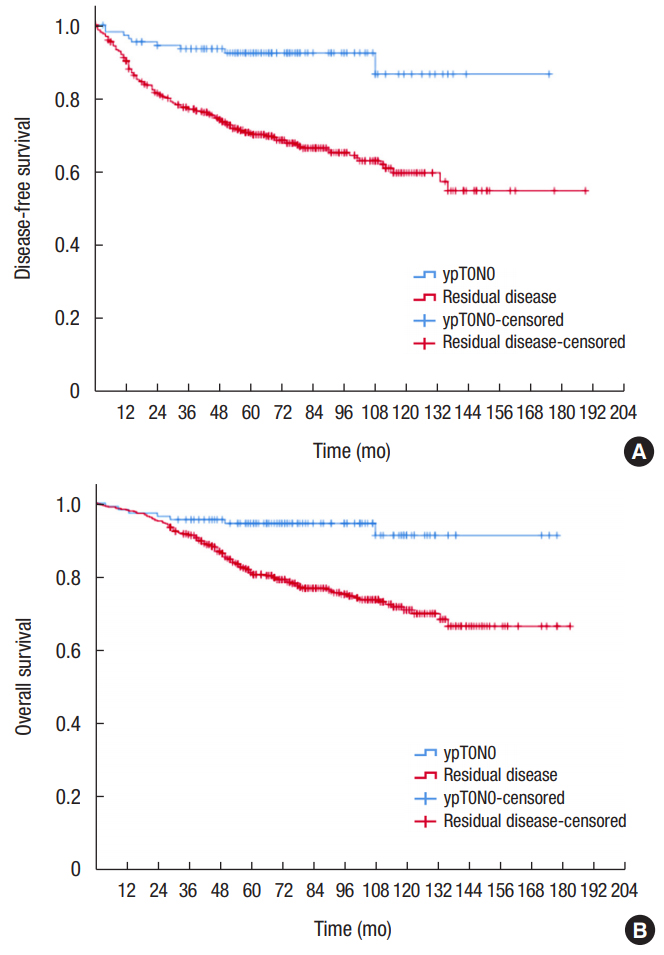
Median follow-up duration was 78 months (range, 1–183 months) for all 580 patients. The 5-year DFS was 92.5% in the pCR group and 70.5% in the residual disease group (P < 0.001) (Fig. 2A). The 5-year OS was 94.5% in the pCR group and 81.1% in the residual disease group (P < 0.001) (Fig. 2B).
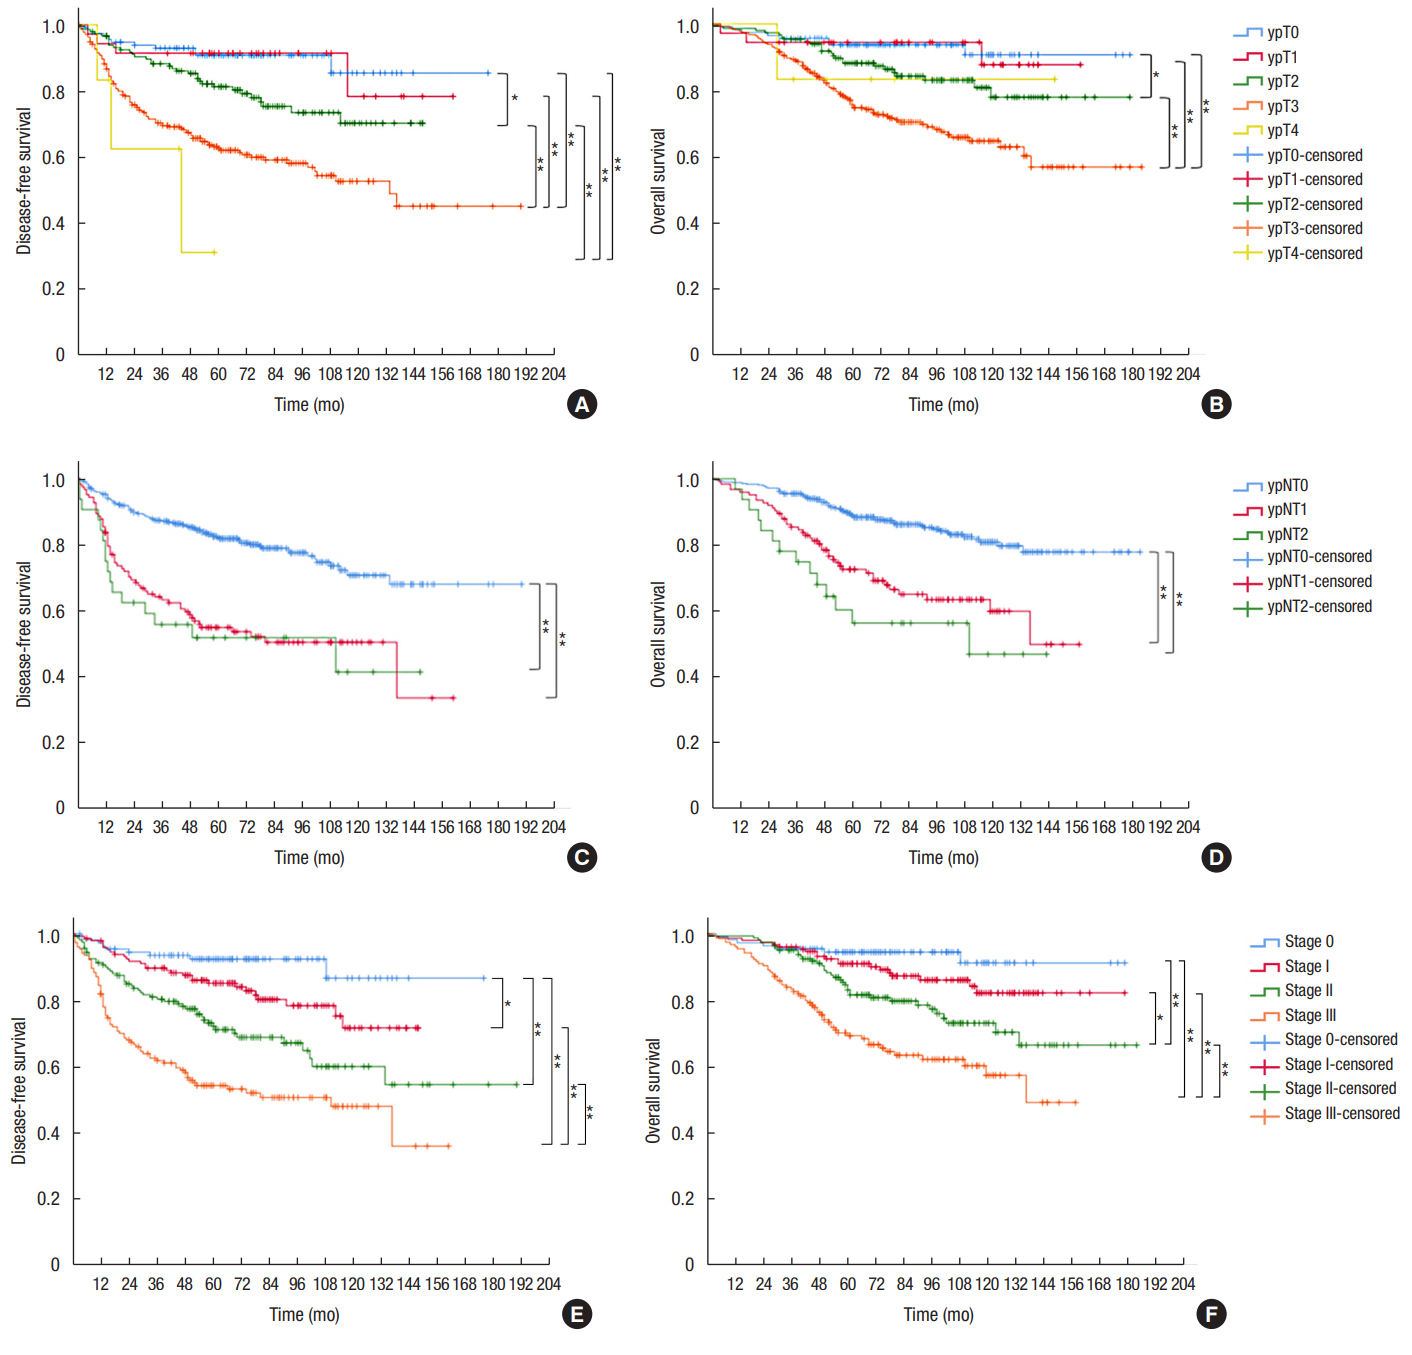
We analyzed survival according to tumor and nodal classification after preoperative CRT (Fig. 3). The 5-year DFS was not significantly different between ypT0 and ypT1 patients (90.8% vs. 91.4%, respectively). However, 5-year DFS rates of ypT2 (81.3%) and ypT3 patients (62.6%) were significantly different from those of patients with other T classifications. Five-year OS was 93.7% for ypT0, 94.4% for ypT1, 88.2% for ypT2, 75.6% for ypT3, and 83.3% for ypT4 patients (P < 0.001). ypN+ patients showed significantly lower OS and DFS than ypN0 patients (Fig. 3C, D). The 5-year DFS was 82.2% for ypN0, 55.0% for ypN1, and 51.9% for ypN2 patients. The 5-year OS was 88.9% for ypN0, 72.6% for ypN1, and 56.4% for ypN2 patients. No difference in survival was observed between ypN1 and ypN2 patients. The 5-year DFS and 5-year OS for patients with ypStages 0–III were 92.5%, 85.1%, 72.2%, 54.3%, and 94.5%, 91.0%, 83.1%, and 69.3%, respectively (both P < 0.001).

Univariable and multivariable analyses

Patients with pCR were more likely to have a longer OS (hazard ratio, 0.23 [95% confidence interval, 0.11–0.50]; P < 0.001) and DFS (hazard ratio, 0.23 [95% confidence interval, 0.12–0.45]; P < 0.001) than those with residual disease. Advanced age, male sex, ASA PS classification III, ultralow anterior resection (vs. low anterior resection), and residual disease (vs. pCR) were significantly associated with lower OS and DFS (Table 3). In multivariable analysis, in addition to the aforementioned factors, circumferential resection margin was an additional significant factor associated with DFS. Pathologic AJCC stage after CRT was the most statistically significant independent predictor of OS and DFS in multivariable analysis (Table 4).

DISCUSSION

In our study, 23.7% of patients treated with neoadjuvant CRT and surgery for rectal cancer achieved pCR; this rate is similar to pCR rates reported in previous studies [13-16]. Patients with pCR showed higher OS and DFS than those with residual disease, and the pCR rate was higher in patients with a low pretreatment CEA level and early tumor classification.
There have been many studies on the applicability of the TNM staging system for patients after treatment, as this staging system was originally developed for patients who had not undergone neoadjuvant therapy. The results of previous studies are consistent in that pCR (stage 0) has been shown to be associated with decreased overall recurrence and improved DFS, and final post-CRT AJCC stage has been shown to be correlated to survival in rectal cancer patients [8, 9, 16-20]. In an analysis of the preoperative CRT arm of the CAO/ARO/AIR-94 trial, ypT classification and nodal status were the most important prognostic factors for DFS [18]. This is in agreement with our results; an increment in ypT and ypN classification stage correlated with worse survival, and the HR for DFS was 1.48 (1.08–2.03) for ypT and 2.68 (2.03–3.54) for ypN. In concordance with our results, Kim et al. [8] reported that both the 5-year OS and 5-year DFS of pCR patients was 100%, and the level of tumor response to preoperative CRT was associated with long-term outcomes. A large pooled analysis demonstrated that rectal cancer patients with pCR had a 5-year OS of 87.6% and a 5-year DFS of 83.3% compared to 76.4% and 65.6%, respectively, for patients with residual disease [15].
The depth of primary tumor invasion before treatment may be correlated with tumor response after neoadjuvant CRT. Patients with early cT classification tended to have a higher rate of pCR. Among patients with a cT2 tumor, 29.5% showed pCR in our study, while patients with cT3 and cT4 showed pCR rates of 18.5% and 5.6%, respectively. Gash et al. [13] reported that clinical T stage was predictive of response, with patients with cT1, cT2, and cT3 more likely to achieve pCR than cT4. Furthermore, in the Habr-Gama study, early local regrowth rate, which refers to local tumor regrowth within 1 year after a “watch and wait” period after preoperative CRT in clinically complete response patients was higher in cT3/T4 patients than cT2 patients (30% vs. 3%, P = 0.007) [21]. These results can be explained by higher residual tumor cells in cT3/T4 tumors than in cT2 tumors, even with tumors showing complete clinical remission after CRT. In the ACOSOG Z6041 study, 49% of cT2N0 tumors showed ypT0 or ypTis after CRT followed by local excision, and the response rate was higher than reported for cT3 patients in a previous study [22]. The higher pCR rate in patients with low levels of pretreatment CEA in our study may be because these tumors had not yet invaded deeply, because CEA levels are lower in patients with earlier stage cancers.
Conversely, some retrospective studies reported contradictory results, in other words no relationship between clinical tumor stage and pCR [14, 23]. In previous retrospective studies, patients were selected according to whether they received preoperative radiotherapy. Therefore, selection bias in these studies is inevitable because cT2 patients with more advanced tumor on physical exam and otherwise candidates for an abdominal perineal resection or intersphincteric resection are more likely to undergo preoperative CRT, whereas most cT3 patients consistently receive preoperative CRT. Thus, interpretation of the data from these studies requires caution.
Our results suggest that identifying ways to increase the pCR rate preoperatively is clinically important for improving the survival of rectal cancer patients and determining treatment strategies; however, none of the preoperative factors we evaluated were significant predictors of pCR (data not shown). This may be due in part to lack of data in our study regarding the time interval between completion of neoadjuvant CRT and surgery, and the various radiation doses and chemotherapy regimens used. Kalady et al. [14] analyzed factors associated with pCR in 242 patients, and in multivariable analyses, they found that an extended RT to surgery interval (>8 weeks) was associated with a higher pCR rate. Moreover, an analysis of 17,255 patients in the NCDB database found that a CRT-surgery interval of more than 8 weeks was related to a higher pCR rate (OR, 1.12), and at 11 weeks, the pCR rate reached a plateau, consistent with the results of the study of Kalady et al. [24]. Further studies should focus on identifying methods to improve preoperative pCR rate, such as performing consolidation chemotherapy and/or increasing RT dose.
Some limitations of the study must be noted. First, this was a retrospective study, and the inevitable drawbacks of a retrospective study are present in our study. Specifically, the patient selection criteria for preoperative CRT may have varied according to the surgeon and time period. We excluded patients with missing data, and thus there could be a selection bias even though data were obtained from a prospectively maintained database. Second, because the study period was long, different chemotherapy regimens could have been employed and inter-observer variability in the interpretation of imaging results could exist. Despite these limitations, the results of this study are consistent with the results of previous studies. The results append the gap in the literature regarding the oncologic outcomes of a large number of rectal cancer patients who underwent CRT with standardized surgery at a single, qualified institution with more than 10 years of follow-up time. The results of this study will serve as reference data for future studies.
In conclusion, rectal cancer patients who achieved pCR had improved OS and DFS than those with residual disease after preoperative CRT, and pCR was an independent indicator of OS and DFS. Pathologic AJCC stage correlated well with patient survival after preoperative CRT.

Notes

CONFLICT OF INTEREST

No potential conflict of interest relevant to this article was reported.

ACKNOWLEDGMENTS

This study was supported by grant from Seoul National University Hospital (Grant no. 0420180530).

Fig. 1.
Study flow chart. SNUH, Seoul National University Hospital; PCRT, preoperative chemoradiotherapy.
ac-2019-04-22-1f1.jpg
Fig. 2.
Kaplan-Meier survival curves for disease-free survival (A), and overall survival (B) for patients with complete pathologic response (ypT0N0, blue line) compared to patients with residual disease (red line).
ac-2019-04-22-1f2.jpg
Fig. 3.
Kaplan-Meier survival curves for disease-free survival and overall survival according to ypT classification (A, B), ypN classification (C, D), and AJCC stage (E, F). *P < 0.05. **P < 0.01.
ac-2019-04-22-1f3.jpg
Table 1.
Patient demographics and tumor characteristics
Characteristic ypT0N0 (n = 111) Residual disease (n = 469) P-value
Age (yr) 62.00 (34–82) 60.00 (27–81) 0.071
Sex 0.114
 Male 66 (59.5) 316 (67.4)
 Female 45 (40.5) 153 (32.6)
Body mass index (kg/m2) 23.36 (16.98–29.15) 22.86 (16.14–33.89) 0.107
ASA PS classification 0.787
 I 48 (43.2) 193 (41.2)
 II 60 (54.1) 266 (56.7)
 III 3 (2.7) 10 (2.1)
Diabetes mellitus 0.983
 No 96 (86.5) 408 (87.0)
 Mild 15 (13.5) 59 (12.6)
 Severe 0 (0) 2 (0.4)
Hypertension 0.695
 No 76 (68.5) 330 (70.4)
 Yes 35 (31.5) 139 (29.6)
Heart disease 0.561
 No 106 (95.5) 454 (96.8)
 Yes 5 (4.5) 15 (3.2)
Pulmonary disease 0.239
 No 108 (97.3) 442 (94.2)
 Yes 3 (2.7) 27 (5.8)
Liver disease 1.000
 No 108 (97.3) 455 (97.0)
 Yes 3 (2.7) 14 (3.0)
Clinical T classificationa <0.001
 cT1 2 (1.8) 1 (0.2)
 cT2 23 (20.9) 55 (11.8)
 cT3 82 (74.5) 361 (77.3)
 cT4 3 (2.7) 50 (10.7)
Tumor location from the anal verge (cm) 0.995
 <4 28 (25.2) 123 (26.2)
 4–8 58 (52.3) 235 (50.1)
 8–12 23 (20.7) 103 (22.0)
 ≥12 2 (1.8) 8 (1.7)
Pretreatment CEA (ng/mL)b 2.0 (0–250) 2.5 (0–336) 0.010
Post-CRT CEA (ng/mL)c 1.6 (0–7) 1.6 (0–45) 0.947
Change in CEA (mg/mL)d 0 (–2 to 247) 1.0 (–2 to 326) 0.136
Adjuvant chemotherapye <0.001
 Yes 70 (63.1) 389 (83.1)
 No 41 (36.9) 79 (16.9)

Values are presented as median (range) or number (%).

ASA PS, American Society of Anesthesiologists physical status; CEA, carcinoembryonic antigen; CRT, chemoradiotherapy.

a Clinical T classification was not available in 1 patient with ypT0N0, and 2 patients with residual disease.

b Data were available for 101 patients with ypT0N0, and 430 patients with residual disease.

c Data were available for 107 patients with ypT0N0, and 437 patients with residual disease.

d Data were available for 98 patients with ypT0N0, and 400 patients with residual disease.

e Data were not available for one patient with residual disease.

Table 2.
Operative data and pathologic outcomes
Variable ypT0N0 (n = 111) Residual disease (n = 469) P-value
Operative name 0.241
 Low anterior resection 64 (57.7) 242 (51.6)
 Ultralow anterior resection 40 (36.0) 189 (40.3)
 Abdominoperineal resection 7 (6.3) 38 (8.1)
Operative time (min) 185 (93–528) 200 (50–740) 0.392
Surgical approach 0.260
 Open 75 (67.6) 350 (74.6)
 Laparoscopy 34 (30.6) 112 (23.9)
 Robot 2 (1.8) 7 (1.5)
Postoperative hospital stay (day) 9 (5–22) 9 (1–57) 0.624
Pathologic AJCC
 Stage 0 111 (100) N/A
 Stage I N/A 151 (32.2)
 Stage II N/A 162 (34.5)
 Stage III N/A 156 (33.3)
Pathologic T classification
 ypT0 111 (100) 4 (0.9)
 ypT1 N/A 36 (7.7)
 ypT2 N/A 150 (32.0)
 ypT3 N/A 273 (58.2)
 ypT4 N/A 6 (1.3)
Pathologic N classification
 ypN0 111 (100) 313 (66.7)
 ypN1 N/A 124 (26.4)
 ypN2 N/A 32 (6.8)
Median No. of harvested LNs (range) 13 (1–34) 13 (1–43) 0.411
Circumferential resection margin 0.144
 Negative 0 (0) 13 (2.8)
 Positive 111 (100) 456 (97.2)

Values are presented as number (%) or median (range).

AJCC, American Joint Committee on Cancer; LNs, lymph nodes.

Table 3.
Cox regression on factors associated with overall survival and disease-free survival
Variable Univariable analysis
Multivariable analysis
Hazard ratio (95% CI) P-value Hazard ratio (95% CI) P-value
Overall survival
 Age 1.04 (1.02–1.05) <0.001 4.18 (1.94–9.01) <0.001
 Sex
  Male 1.00 (reference) - 1.00 (reference) -
  Female 0.45 (0.28–0.70) 0.001 0.50 (0.32–0.80) 0.003
 ASA PS classification
  I 1.00 (reference) - 1.00 (reference) -
  II 1.72 (1.15–2.57) 0.008 1.39 (0.92–2.09) 0.120
  III 6.81 (3.28–14.15) <0.001 3.77 (1.70–8.36) 0.001
 Body mass index 0.99 (0.93–1.06) 0.810 - -
 Pretreatment CEA 1.00 (1.00–1.00) 0.630 - -
 Tumor location from the anal verge (cm)
  ≥12 1.00 (reference) - -
  8–12 1.53 (0.21–11.27) 0.680 -
  4–8 2.05 (0.28–14.76) 0.480 -
  <4 1.88 (0.25–13.85) 0.540 -
 Operative name
  Low anterior resection 1.00 (reference) - 1.00 (reference) -
  Ultralow anterior resection 1.56 (1.07–2.28) 0.020 1.58 (1.08–2.32) 0.020
  Abdominoperineal resection 1.35 (0.66–2.75) 0.410 1.12 (0.54–2.30) 0.770
 Circumferential resection margin
  Negative 1.00 (reference) - -
  Positive 2.36 (0.87–6.40) 0.090 - -
 Tumor response to preoperative CRT
  pCR (ypT0N0) 1.00 (reference) <0.001 1.00 (reference) -
  Residual disease 3.95 (1.84–8.48) - 4.18 (1.94–9.01) <0.001
 Postoperative chemotherapy
  No 1.00 (reference) - - -
  Yes 0.82 (0.52–1.29) 0.390 - -
Disease-free survival
 Age 1.02 (1.01–1.04) 0.003 1.02 (1.01–1.04) 0.007
 Sex
  Male 1.00 (reference) - 1.00 (reference) -
  Female 0.56 (0.39–0.81) 0.002 0.65 (0.45–0.94) 0.020
 ASA PS classification
  I 1.00 (reference) - 1.00 (reference) -
  II 1.56 (1.11–2.18) 0.010 1.26 (0.89–1.80) 0.190
  III 4.10 (2.02–8.33) <0.001 2.66 (1.25–5.68) 0.010
 Body mass index 1.00 (0.95–1.05) 0.930 - -
 Pretreatment CEA 1.00 (1.00–1.00) 0.130 - -
 Tumor location from the anal verge (cm)
  ≥12 1.00 (reference) - - -
  8–12 1.17 (0.28–4.86) 0.830 - -
  4–8 1.20 (0.30–4.91) 0.790 - -
  <4 1.21 (0.29–5.02) 0.800 - -
 Operative name
  Low anterior resection 1.00 (reference) - 1.00 (reference) -
  Ultralow anterior resection 1.51 (1.09–2.09) 0.010 1.45 (1.04–2.03) 0.030
  Abdominoperineal resection 1.62 (0.91–2.87) 0.100 1.42 (0.79–2.53) 0.240
 Circumferential resection margin
  Negative 1.00 (reference) - 1.00 (reference) -
  Positive 3.59 (1.68–7.69) 0.001 2.52 (1.15–5.53) 0.020
 Tumor response to preoperative CRT
  pCR (ypT0N0) 1.00 (reference) - 1.00 (reference) -
  Residual disease 4.38 (2.23–8.58) <0.001 4.33 (2.20–8.51) <0.001
 Postoperative chemotherapy
  No 1.00 (reference) - - -
  Yes 1.05 (0.70–1.59) 0.800 - -

CI, confidence interval; ASA PS, American Society of Anesthesiologists physical status; CEA, carcinoembryonic antigen; CRT, chemoradiotherapy; pCR, pathologic complete response.

Table 4.
Cox regression on association between pathologic stage after preoperative chemoradiotherapy (CRT) and survival outcomes
Variable Univariable analysis
Multivariable analysis
Hazard ratio (95% CI) P-value Hazard ratio (95% CI) P-value
Overall survivala
 Pathologic AJCC after preoperative CRT
  Stage 0 1.00 (reference) - 1.00 (reference) -
  Stage I 1.97 (0.83–4.67) 0.120 2.20 (0.93–5.23) 0.070
  Stage II 3.62 (1.61–8.13) 0.002 3.75 (1.66–8.47) 0.001
  Stage III 3.77 (3.08–14.87) <0.001 6.97 (3.16–15.39) <0.001
 Pathologic T classification
  ypT0 1.00 (reference) - 1.00 (reference) -
  ypT1 1.14 (0.30–4.30) 0.850 1.32 (0.35–5.02) 0.690
  ypT2 2.23 (1.00–4.97) 0.050 1.97 (0.88–4.43) 0.100
  ypT3 4.78 (2.31–9.87) <0.001 3.61 (1.69–7.70) 0.001
  ypT4 3.03 (0.38–24.26) 0.300 1.98 (0.24–16.23) 0.520
 Pathologic N classification
  ypN0 1.00 (reference) - 1.00 (reference) -
  ypN1 2.65 (1.79–3.94) <0.001 1.86 (1.22–2.83) 0.004
  ypN2 3.95 (2.21–7.06) <0.001 3.10 (1.69–5.70) <0.001
Disease-free survivalb
 Pathologic AJCC after preoperative CRT
  Stage 0 1.00 (reference) - 1.00 (reference) -
  Stage I 2.24 (1.06–4.75) 0.040 2.33 (1.09–4.94) 0.030
  Stage II 4.10 (2.01–8.35) <0.001 4.05 (1.98–8.28) <0.001
  Stage III 7.45 (3.73–14.90) <0.001 7.30 (3.63–14.67) <0.001
 Pathologic T classification
  ypT0 1.00 (reference) - 1.00 (reference) -
  ypT1 1.05 (0.33–3.35) 0.930 1.07 (0.34–3.40) 0.910
  ypT2 2.21 (1.09–4.49) 0.030 2.01 (1.01–4.00) 0.050
  ypT3 4.65 (2.43–8.89) <0.001 3.52 (1.85–6.71) <0.001
  ypT4 8.71 (2.39–31.74) 0.001 5.72 (1.41–23.25) 0.020
 Pathologic N classification
  ypN0 1.00 (reference) - 1.00 (reference) -
  ypN1 2.81 (2.01–3.93) <0.001 2.01 (1.41–2.86) <0.001
  ypN2 3.26 (1.91–5.57) <0.001 2.30 (1.31–4.04) 0.004

CI, confidence interval; AJCC, American Joint Committee on Cancer.

a Adjusted for age, sex, American Society of Anesthesiologists physical status (ASA PS) classification, and operative name.

b Adjusted for age, sex, ASA PS classification, operative name, and circumferential resection margin.

REFERENCES

1. Jung KW, Won YJ, Kong HJ, Lee ES; Community of Population-Based Regional Cancer Registries. Cancer statistics in Korea: incidence, mortality, survival, and prevalence in 2015. Cancer Res Treat 2018;50:303–16.
crossref pmid pmc pdf
2. Bray F, Ferlay J, Soerjomataram I, Siegel RL, Torre LA, Jemal A. Global cancer statistics 2018: GLOBOCAN estimates of incidence and mortality worldwide for 36 cancers in 185 countries. CA Cancer J Clin 2018;68:394–424.
crossref pmid
3. National Comprehensive Cancer Network. NCCN clinical practice guidelines in oncology (NCCN Guidelines): rectal cancer (Version 3.2018) [Internet]. Fort Wathington (PA), National Comprehensive Cancer Network; 2018 [cited 2019 Feb 6]. Available from: https://www.nccn.org/professionals/physician_gls/pdf/rectal.pdf

4. van Gijn W, Marijnen CA, Nagtegaal ID, Kranenbarg EM, Putter H, Wiggers T, et al. Preoperative radiotherapy combined with total mesorectal excision for resectable rectal cancer: 12-year follow-up of the multicentre, randomised controlled TME trial. Lancet Oncol 2011;12:575–82.
crossref pmid
5. Sauer R, Becker H, Hohenberger W, Rödel C, Wittekind C, Fietkau R, et al. Preoperative versus postoperative chemoradiotherapy for rectal cancer. N Engl J Med 2004;351:1731–40.
crossref pmid
6. Sauer R, Liersch T, Merkel S, Fietkau R, Hohenberger W, Hess C, et al. Preoperative versus postoperative chemoradiotherapy for locally advanced rectal cancer: results of the German CAO/ARO/AIO-94 randomized phase III trial after a median follow-up of 11 years. J Clin Oncol 2012;30:1926–33.
crossref pmid
7. Janjan NA, Khoo VS, Abbruzzese J, Pazdur R, Dubrow R, Cleary KR, et al. Tumor downstaging and sphincter preservation with preoperative chemoradiation in locally advanced rectal cancer: the M. D. Anderson Cancer Center experience. Int J Radiat Oncol Biol Phys 1999;44:1027–38.
crossref pmid
8. Kim NK, Baik SH, Seong JS, Kim H, Roh JK, Lee KY, et al. Oncologic outcomes after neoadjuvant chemoradiation followed by curative resection with tumor-specific mesorectal excision for fixed locally advanced rectal cancer: Impact of postirradiated pathologic downstaging on local recurrence and survival. Ann Surg 2006;244:1024–30.
crossref pmid pmc
9. Yeo SG, Kim DY, Park JW, Choi HS, Oh JH, Kim SY, et al. Stage-to-stage comparison of preoperative and postoperative chemoradiotherapy for T3 mid or distal rectal cancer. Int J Radiat Oncol Biol Phys 2012;82:856–62.
crossref pmid
10. Habr-Gama A, Perez RO, Nadalin W, Sabbaga J, Ribeiro U Jr, Silva e Sousa AH Jr, et al. Operative versus nonoperative treatment for stage 0 distal rectal cancer following chemoradiation therapy: long-term results. Ann Surg 2004;240:711–7.
crossref pmid pmc
11. Renehan AG, Malcomson L, Emsley R, Gollins S, Maw A, Myint AS, et al. Watch-and-wait approach versus surgical resection after chemoradiotherapy for patients with rectal cancer (the OnCoRe project): a propensity-score matched cohort analysis. Lancet Oncol 2016;17:174–83.
crossref pmid
12. Lee JH, Chie EK, Kim K, Jeong SY, Park KJ, Park JG, et al. The influence of the treatment response on the impact of resection margin status after preoperative chemoradiotherapy in locally advanced rectal cancer. BMC Cancer 2013;13:576.
crossref pmid pmc pdf
13. Gash KJ, Baser O, Kiran RP. Factors associated with degree of tumour response to neo-adjuvant radiotherapy in rectal cancer and subsequent corresponding outcomes. Eur J Surg Oncol 2017;43:2052–9.
crossref pmid
14. Kalady MF, de Campos-Lobato LF, Stocchi L, Geisler DP, Dietz D, Lavery IC, et al. Predictive factors of pathologic complete response after neoadjuvant chemoradiation for rectal cancer. Ann Surg 2009;250:582–9.
crossref pmid
15. Maas M, Nelemans PJ, Valentini V, Das P, Rödel C, Kuo LJ, et al. Long-term outcome in patients with a pathological complete response after chemoradiation for rectal cancer: a pooled analysis of individual patient data. Lancet Oncol 2010;11:835–44.
crossref pmid
16. Chan AK, Wong A, Jenken D, Heine J, Buie D, Johnson D. Posttreatment TNM staging is a prognostic indicator of survival and recurrence in tethered or fixed rectal carcinoma after preoperative chemotherapy and radiotherapy. Int J Radiat Oncol Biol Phys 2005;61:665–77.
crossref pmid
17. Kuo LJ, Liu MC, Jian JJ, Horng CF, Cheng TI, Chen CM, et al. Is final TNM staging a predictor for survival in locally advanced rectal cancer after preoperative chemoradiation therapy? Ann Surg Oncol 2007;14:2766–72.
crossref pmid
18. Rodel C, Martus P, Papadoupolos T, Füzesi L, Klimpfinger M, Fietkau R, et al. Prognostic significance of tumor regression after preoperative chemoradiotherapy for rectal cancer. J Clin Oncol 2005;23:8688–96.
crossref pmid
19. Habr-Gama A, Perez RO, Nadalin W, Nahas SC, Ribeiro U Jr, Silva E Sousa AH Jr, et al. Long-term results of preoperative chemoradiation for distal rectal cancer correlation between final stage and survival. J Gastrointest Surg 2005;9:90–9.
crossref pmid
20. Stipa F, Chessin DB, Shia J, Paty PB, Weiser M, Temple LK, et al. A pathologic complete response of rectal cancer to preoperative combined-modality therapy results in improved oncological outcome compared with those who achieve no downstaging on the basis of preoperative endorectal ultrasonography. Ann Surg Oncol 2006;13:1047–53.
crossref pmid pdf
21. Habr-Gama A, São Julião GP, Gama-Rodrigues J, Vailati BB, Ortega C, Fernandez LM, et al. Baseline T classification predicts early tumor regrowth after nonoperative management in distal rectal cancer after extended neoadjuvant chemoradiation and initial complete clinical response. Dis Colon Rectum 2017;60:586–94.
crossref pmid
22. Garcia-Aguilar J, Renfro LA, Chow OS, Shi Q, Carrero XW, Lynn PB, et al. Organ preservation for clinical T2N0 distal rectal cancer using neoadjuvant chemoradiotherapy and local excision (ACOSOG Z6041): results of an open-label, single-arm, multi-institutional, phase 2 trial. Lancet Oncol 2015;16:1537–46.
crossref pmid pmc
23. Dinaux AM, Amri R, Bordeianou LG, Hong TS, Wo JY, Blaszkowsky LS, et al. The impact of pathologic complete response in patients with neoadjuvantly treated locally advanced rectal cancer-a large single-center experience. J Gastrointest Surg 2017;21:1153–8.
crossref pmid pdf
24. Probst CP, Becerra AZ, Aquina CT, Tejani MA, Wexner SD, Garcia-Aguilar J, et al. Extended intervals after neoadjuvant therapy in locally advanced rectal cancer: the key to improved tumor response and potential organ preservation. J Am Coll Surg 2015;221:430–40.
crossref pmid pmc


ABOUT
ARTICLE CATEGORY

Browse all articles >

BROWSE ARTICLES
AUTHOR INFORMATION
Editorial Office
Room 1519, Suseo Hyundai Venture-vill, 10 Bamgogae-ro 1-gil, Gangnam-gu, Seoul 06349, Korea
Tel: +82-2-2040-7737    Fax: +82-2-2040-7735    E-mail: editor@coloproctol.org                

Copyright © 2024 by Korean Society of Coloproctology.

Developed in M2PI

Close layer