Ann Coloproctol Search

CLOSE


Ann Coloproctol > Volume 39(5); 2023 > Article
Ryu, Park, Ahn, Park, Kim, Kim, Lim, and Kim: Prognostic significance of lymph node yield on oncologic outcomes according to tumor response after preoperative chemoradiotherapy in rectal cancer patients

Abstract

Purpose

This study aimed to evaluate the predictive value of lymph node yield (LNY) for survival outcomes according to tumor response after preoperative chemoradiotherapy (PCRT) in patients with rectal cancer.

Methods

This study was a retrospective study conducted in a tertiary center. A total of 1,240 patients with clinical stage II or III rectal cancer who underwent curative resection after PCRT between 2007 and 2016 were included. Patients were categorized into the good response group (tumor regression grade [TRG], 0–1) or poor response group (TRG, 2–3). Propensity score matching was performed for age, sex, and pathologic stage between LNY of ≥12 and LNY of <12 within tumor response group. The primary outcome was 5-year disease-free survival (DFS) and overall survival (OS).

Results

LNY and positive lymph nodes were inversely correlated with TRG. In good responders, 5-year DFS and 5-year OS of patients with LNY of <12 were better than those with LNY of ≥12, but there was no statistical significance. In poor responders, the LNY of <12 group had worse survival outcomes than the LNY of ≥12 group, but there was also no statistical significance. LNY of ≥12 was not associated with DFS and OS in multivariate analysis.

Conclusion

LNY of <12 showed contrasting outcomes between the good and poor responders in 5-year DFS and OS. LNY of 12 may not imply adequate oncologic surgery or proper staging in rectal cancer patients treated by PCRT. Furthermore, a decrease in LNY should be comprehended differently according to tumor response.

Graphical abstract

INTRODUCTION

Considering that lymph node (LN) status represents a major prognostic factor in colorectal cancer, it is important to obtain a sufficient number of LNs to avoid the underestimation of metastatic LNs [1]. The examination of more LNs allows for more accurate staging and better tailored adjuvant treatments in patients with node-positive disease. Furthermore, the total number of retrieved LNs is associated with survival rates [2, 3]. A more thorough node clearance may itself result in lower rates of recurrence. Other factors associated with LN retrieval, such as the extent and quality of surgical resection, may also affect survival. Therefore, LN retrieval is recognized as a parameter that indicates the quality of oncologic surgery and is suggested as one of the determinants for providing adjuvant treatment in colorectal cancer patients with pathologic T3N0. The current guidelines recommend that at least 12 LNs should be examined to optimize staging [1, 4].
Previous studies have demonstrated that preoperative chemoradiotherapy (PCRT) significantly decreases LN yield (LNY) [5, 6]. However, the implications of lower LNY in patients who underwent PCRT are still unclear. Several studies have suggested that LNY is associated with oncologic outcomes, and efforts should be made to investigate a minimum of 12 LNs [7, 8]. However, some studies have shown that LNY is not significantly associated with survival outcomes even for patients with rectal cancer who received PCRT [9, 10].
A reduction in LNY after PCRT is probably associated with the response to PCRT [11]. Regarding the association between tumor regression and LNY, several studies have shown that a poor tumor regression grade (TRG) is associated with a high LNY [6, 12]. Some studies have suggested that a lower LNY represents a better tumor response, which is associated with a good prognosis [13]. In contrast, some studies have reported that a low LNY is not associated with good tumor response [12]. The relevance in the oncologic outcomes of TRG and LNY is still contradictory.
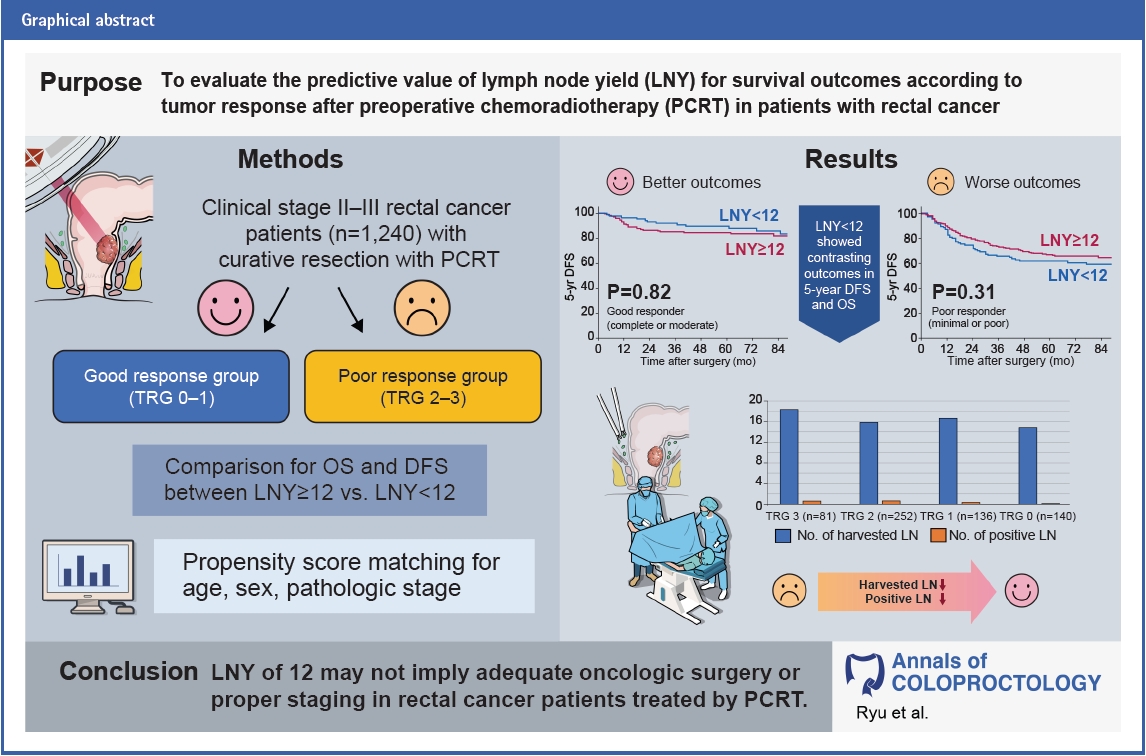
Therefore, whether a cutoff of at least 12 LNs is appropriate for rectal cancer patients who received PCRT is questionable. In this study, we aimed to evaluate the predictive value of LNY of 12 for survival outcomes according to tumor response after PCRT in patients with rectal cancer.

METHODS

Ethics statement

This study was approved by the Institutional Review Board of Asan Medical Center in Seoul, Korea (No. 2022-0005), with a waiver for informed consent due to the retrospective nature of the study. The study protocol conformed to the tenets of the Declaration of Helsinki.

Enrollment, eligibility, and treatment

Data on all patients with rectal cancer who underwent curativeintent surgery after PCRT between January 2007 and December 2016 were collected in an institutional database. Patients with clinical stage II or III locally advanced rectal cancer after PCRT were considered eligible for inclusion. We excluded patients with hereditary colorectal cancer, inflammatory bowel disease-associated colorectal cancer, synchronous or metachronous cancer, and metastatic rectal cancer and patients who received extended surgery beyond total mesorectal excision. Cancer staging was based on the latest American Joint Committee on Cancer (AJCC) manual at the time of surgery.

Treatment protocols

PCRT included external beam radiation at a total dose of 50.0 to 50.4 Gy in 1.8 to 2.0 Gy fractions, followed by a 4.0 to 5.4 Gy boost in 1.8 to 2.0 Gy fractions and concurrent oral capecitabine or intravenous 5-fluorouracil with leucovorin. Some patients received study-based concurrent chemotherapeutic regimens such as 5-fluorouracil/leucovorin/oxaliplatin, S-1, temozolomide, target agent. Curative-intent surgery was performed according to the principles of total mesorectal excision at 6 to 8 weeks after the completion of PCRT. All operations were performed by 7 experienced colorectal surgeons (50 rectal cancer operations per year for >5 years) by using standardized techniques. Adjuvant chemotherapy was recommended in most cases, except for patients with serious comorbidities, severe side effects expected after chemotherapy, or poor general performance. The regimens and cycles of adjuvant chemotherapy were administered according to the standard protocol, as previously described [14].

Pathologic evaluation

For the complete examination of the harvested LNs, node-bearing pericolic adipose tissue was separated from the specimen. The specimen was carefully palpated for the presence of LNs, and all candidate LNs were dissected for evaluation. The submitted tissue was fixed in 10% buffered formalin for 24 to 48 hours at room temperature before automated tissue processing and embedding to create formalin-fixed, paraffin-embedded tissue blocks. Fivemicron tissue sections were stained with hematoxylin and eosin by using a Leica XL Autostainer (Leica Biosystems) on the basis of the manufacturer’s protocol. The slides were reviewed by pathologists for the number of LNs removed and the presence or absence of metastatic tumors in the LN. If the number of examined LNs is less than 12, additional sections were submitted in an attempt to retrieve additional LNs.
The pathologic response to PCRT was evaluated in the resected specimens by using the AJCC/College of American Pathologists TRG system according to the volume of residual tumor cells as follows: grade 0 (complete response), no remaining viable cancer cells; grade 1 (moderate response), only a small cluster or single cancer cells; grade 2 (minimal response), residual cancer remaining but with predominant fibrosis; and grade 3 (poor response), minimal or no killing of the tumor with extensive residual cancer [15]. On the basis of TRG assessment, we categorized the patients into the good response group (patients with complete or moderate response) or poor response group (patients with minimal or poor response).

Follow-up protocols

All patients were regularly examined every 6 months for the first 5 years after the operation. History taking and physical examination were performed, and laboratory tests including serum carcinoembryonic antigen levels, chest radiography, and abdominopelvic computed tomography (CT) were repeated every 6 months during the follow-up period. Chest CT has been performed annually. Colonoscopy was performed within 1 year after the operation and then once every 2 to 3 years. The primary endpoints were 5-year disease-free survival (DFS) and overall survival (OS) during a median follow-up of 64 months (interquartile range, 55–90 months).

Statistical analysis

The quantitative variables were expressed as means with standard deviations, and categorical variables were presented as numbers and frequencies. We used the chi-square test to compare the distribution of categorical variables, and the t-test was used for continuous variables. The correlation between LNY, positive LNs, and TRG was evaluated using Spearman correlation analysis. Nearest neighbor propensity score matching was performed to reduce the effects of confounding factors between the LNY of ≥12 and LNY of <12 groups, including age, sex, and pathologic stage within the tumor response group. A propensity score was calculated from the logistic equation for each predicted probability, and propensity score matching was performed using the oneto-two method without replacement by using the closest propensity scores. Only patients matched with propensity scores were included in the time-to-event analyses. DFS and OS were calculated using the Kaplan-Meier method and were compared using the log-rank test, and the results were further validated using a Cox proportional hazards regression model. Confounding factors were selected in a forward selection procedure with a limit of 5% change in effect size by using a basic logistic regression model. Statistical significance was established with a 2-sided test at P<0.05. All statistical analyses were performed using IBM SPSS ver. 25.0 (IBM Corp) and R ver. 4.1.2 (R Project for Statistical Computing).

RESULTS

Clinicopathologic characteristics

A total of 1,240 patients with locally advanced rectal cancer who underwent PCRT, followed by curative resection, were included in our study. Table 1 presents the patients and tumor characteristics of the patients and the comparison of the LNY of ≥12 and <12 groups. Among the patients, 1,037 patients (83.6%) had ≥12 harvested LNs, 469 patients (37.8%) had a good response (TRG, 0–1), and 189 patients (15.2%) had a pathological complete response. The mean number of harvested LNs was 17.8. Compared with the LNY of ≥12 group, the LNY of <12 group was significantly older (60.0 years vs. 59.6 years, P<0.001) and had a lower clinical stage and pathologic stage (all P<0.001). The proportion of pathologic complete response was also higher in the LNY of <12 group as compared to the LNY of ≥12 group (22.7% vs. 13.8%, P=0.008).
The mean number of harvested LNs and positive LNs according to TRG was analyzed (Table 2). There was a significant difference in the mean number of harvested LNs (P=0.001) and positive LNs (P<0.001) between each TRG group. The LNY (r=0.106, P<0.001) and positive LNs (r=0.247, P<0.001) were inversely correlated with TRG by correlation analysis.
Tables 3 and 4 show a summary of the patient characteristics according to LNY after propensity score matching. In the good response group, the 86 propensity score–matched patients in the LNY of <12 group were compared with the 172 patients who had LNY of ≥12. The LNY of <12 group had a higher proportion of clinical N0 stage (23.3% vs. 10.5%, P=0.003) and were more likely to receive adjuvant chemotherapy (98.8% vs. 94.8%, P=0.049) than the LNY of ≥12 group (Table 3). In the poor response group, the 117 propensity score–matched patients in the LNY of <12 group were compared with 234 patients in the LNY of ≥12 group. The LNY <12 group had a lower proportion of clinical T4 stage than the LNY of ≥12 group (1.7% vs. 9.0%, P=0.001) and had a different distribution of clinical N stage (P=0.037) than the LNY of ≥12 group (Table 4). There were no other significant differences in clinicopathological characteristics such as tumor location, histologic type, lymphovascular invasion, perineural invasion (PNI), and circumferential resection margin involvement between the 2 groups.

Association of LNY with oncologic outcomes

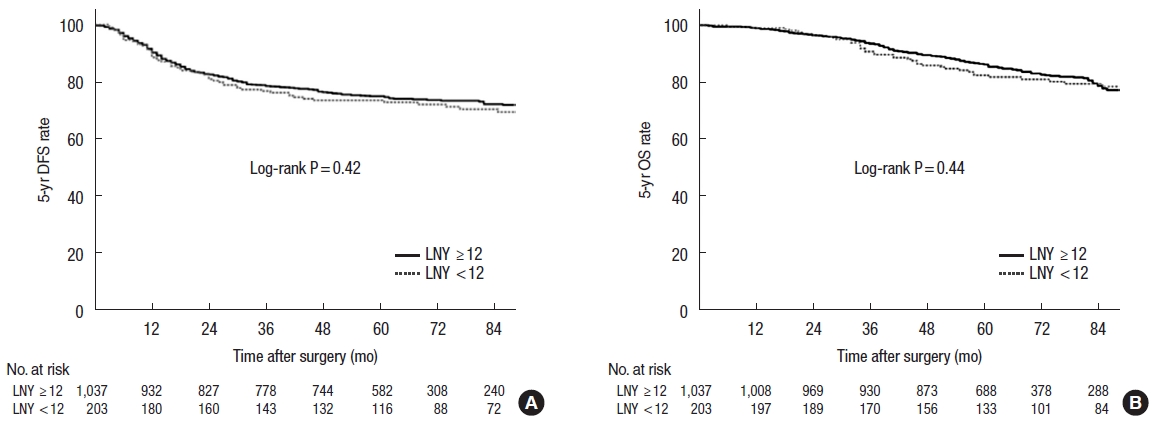
The Kaplan-Meier curves for 5-year DFS (P=0.42) and 5-year OS (P=0.44) comparing LNY of ≥12 and <12 also did not show significant differences (Fig. 1).
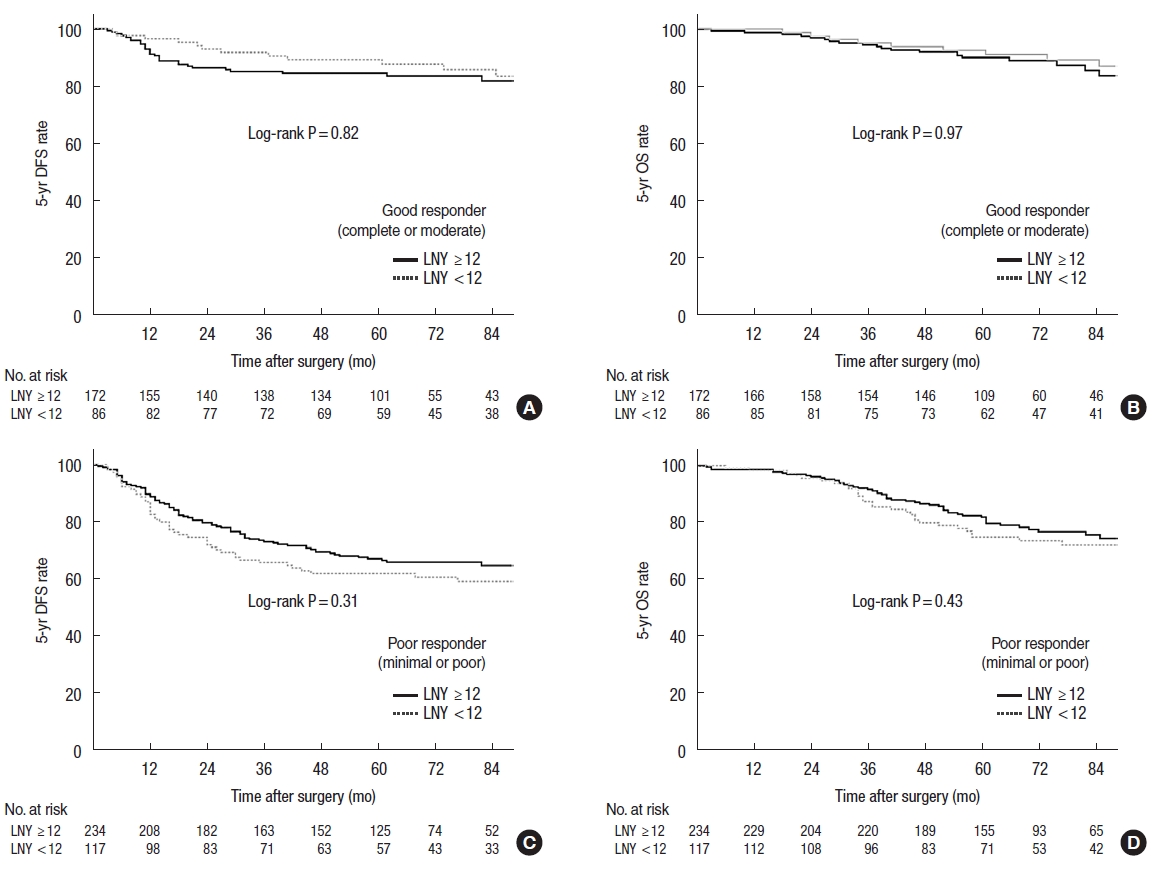
We further analyzed the DFS and OS according to LNY in the good and poor response groups. In the good response group, patients in the LNY of <12 group had a higher 5-year DFS and 5-year OS than those in the LNY of ≥12 group but did not produce a statistical significance (P=0.82 and P=0.97, respectively) (Fig. 2A, B). By contrast, in the poor response group, the LNY <12 group had a poorer 5-year DFS (P=0.31) and 5-year OS (P=0.43) than the LNY of ≥12 group (Fig. 2C, D).
Multivariate analysis was performed separately according to the tumor response group. LNY was not found to have a significant association with DFS and OS in both the good response group and poor response group (Tables 5, 6). In the good response group, undifferentiated histologic type, PNI, advanced ypT stage, and ypN positive disease were revealed as risk factors for DFS. Histologic type, PNI, and ypN+ were significant risk factors for OS (Table 5). Similarly, in the poor response group, histologic type, PNI, ypT stage, and ypN stage were associated factors for poor DFS and OS (Table 6).

DISCUSSION

This study showed that the retrieval of <12 LNs did not lead to significant differences in the subsequent oncologic outcomes for patients with locally advanced rectal cancer who received PCRT. An LNY of <12 showed, however, contrasting outcomes within the good and poor response groups. Among good responders, survival outcomes for those with LNY of <12 were better than those with LNY of ≥12. In contrast, among poor responders, the survival outcomes for those with LNY of <12 were worse than those with LNY of ≥12 but did not reach significance.
The association between PCRT and decreased LNY from a specimen is widely accepted [5, 6, 11, 16]. A large-scale retrospective study [6] showed that PCRT significantly decreases the mean number of LNs retrieved in patients treated with PCRT compared with those not treated with PCRT, and the reduction rate of LNY by PCRT was approximately 33%. A recent meta-analysis [5] also confirmed a mean decrease of LNY of 3.9 in the PCRT group.
PCRT affects LNs via lymphocyte apoptosis within the nodes, in addition to atrophy and fibrosis of the stroma [17, 18]. An increase in the expression of the proapoptotic gene p53 in irradiated lymphocytes, which are highly sensitive to radiation, results in stromal atrophy, fibrosis, and shrinkage, thus leading to the reduction in lymph node size, making them unrecognizable and less likely to contain malignant cells [18, 19]. For these reasons, a lower LNY would be reported in patients with good tumor response after PCRT. In the population of the current study, we showed that there was a significant correlation between LNY and positive LNs with TRG. The results of this study agree with those of prior studies [13]. In addition, some studies reported that good tumor response was an independent predictor for LNY of <12 in multivariate analysis [9, 11, 20]. They concluded that the decrease in LNY after PCRT was affected by tumor response to chemoradiation.
Given that PCRT significantly reduces LNY, the implication of LNY as a prognostic factor in patients who received PCRT should be interpreted with caution. In this study, an LNY of <12 did not have a significant effect on DFS and OS. In line with our results, several studies have shown that an LNY of 12 was not associated with oncologic outcomes in patients who underwent PCRT [911, 16, 2123].
Considering the relationship between tumor response and LNY, a low LNY might be interpreted differently in good responders. Although the difference did not reach statistical significance, we identified favorable DFS and OS in good responders with LNY of <12, which is contrary direction with those in poor responders. de Campos-Lobato et al. [22] reported that LNY of <12 had more pathologic complete responses and that the 5-year local recurrence rate was lower in patients with good response and LNY of <12 than in those with LNY of ≥12. They suggested that the retrieval of <12 LNs may be a marker of higher tumor response and decreased local recurrence rate. Kim et al. [13] also reported a more favorable DFS in good responders with LNY of <12 than in those with LNY of ≥12. Consistent with prior studies, the LNY of <12 group had more pathologic complete response in the population of the current study.
On the contrary, patients with poor response represented higher LNY and have worse survival outcomes when they have <12 harvested LNs. Wang et al. [24] reported that LNY reduction was preferentially observed in cases with good tumor response, and poor responding tumors were found to bear the same number of LNs as tumors that had not been subjected to PCRT. They concluded that the ideal number of LNY may differ according to tumor response. However, for poor responders, 12 LNs may be justified.
Although our results did not show a significant difference in oncologic outcomes according to LNY in both good and poor responders, they showed opposing trends in DFS and OS. Therefore, it is necessary to consider the possibility that the oncologic effect of LNY may differ depending on the tumor response.
Our study has some limitations. First, this was a retrospective, single-center study; therefore, it may have an inherent selection bias even though we attempted to control for known confounders via adjusted analysis. Second, there is a possibility that the skill of the technician may have affected the number of LNs submitted for the examination despite the use of the standardized procedure in the process of making the slide. If LNY was <12, a more skilled technician performed an additional inspection to avoid missing LNs due to the inexperience of the technician. In addition, we did not consider all factors that could affect LNY. In our analysis, age, sex, and pathological stage were adjusted. Multiple factors, such as tumor location, type of surgery, and body mass index, are also likely to affect LNY [6, 25]. Also, details of adjuvant chemotherapy which might have affected the oncologic result have not been investigated. Finally, we did not show the optimal cutoff of LNY representing the difference in survival rates in patients treated with PCRT; however, it is not the purpose of the present study and will be studied in the future. Despite these limitations, our study could clarify the implications of LNY in rectal cancer patients after PCRT. The fewer LNs retrieved after PCRT does not imply an inadequate oncologic resection and may indicate a tumor response. Thus, we consider that the current recommendation of ≥12 LNs does not seem to be reasonable for patients with rectal cancer patients who underwent PCRT.
In conclusion, LNY of <12 showed contrasting outcomes between good and poor responders. LNY of 12 may not imply adequate oncologic surgery or proper staging in patients with rectal cancer treated by PCRT. Furthermore, decreased LNY should be comprehended differently according to tumor response.

Notes

Conflict of interest

In Ja Park is the Editor-in-Chief of Annals of Coloproctology, but was not involved in the review process of this article. No other potential conflict of interest relevant to this article was reported.

Funding

None.

Author contributions

Conceptualization: HSR, IJP; Data curation: all authors; Formal analysis: HSR, IJP; Investigation: all authors; Methodology: HSR, BKA; Project administration: IJP, SBL, JCK; Resources: YIK; Software: MSK, MYP; Supervision: IJP, SBL, JCK; Validation: IJK; Visualization: HSR, YIK; Writing–original draft: HSR; Writing–review & editing: all authors. All authors read and approved the final manuscript.

Fig. 1.
Cumulative 5-year (A) disease-free survival (DFS) and (B) overall survival (OS) rates in the whole study population. LNY, lymph node yield.
ac-2022-00143-0020f1.jpg
Fig. 2.
Cumulative 5-year disease-free survival (DFS) and overall survival (OS) rates according to tumor regression grade (TRG) after propensity score matching. (A) DFS and (B) OS in patients with good response (TRG, 0–1). (C) DFS and (D) OS in patients with a poor response (TRG, 2–3). LNY, lymph node yield.
ac-2022-00143-0020f2.jpg
ac-2022-00143-0020f3.jpg
Table 1.
Patient and tumor characteristics and comparison of the LNY ≥12 and <12 groups
Clinicopathologic parameter Total (n=1,240) LNY ≥12 (n=1,037) LNY <12 (n=203) P-value
Sex 0.890
 Male 830 (66.9) 695 (67.0) 135 (66.5)
 Female 410 (33.1) 342 (33.0) 68 (33.5)
Age (yr) 57.4±10.2 56.9±10.4 60.0±9.1 <0.001
Clinical T stage <0.001
 cT2 7 (0.6) 6 (0.6) 1 (0.5)
 cT3 1,143 (92.2) 946 (91.2) 197 (97.0)
 cT4 90 (7.3) 85 (8.2) 5 (2.5)
Clinical N stage <0.001
 cN0 90 (7.3) 62 (6.0) 28 (13.8)
 cN1 390 (31.5) 309 (29.8) 81 (39.9)
 cN2 760 (61.3) 666 (64.2) 94 (46.3)
Tumor location 0.680
 Low (0–4 cm from the AV) 789 (63.6) 660 (63.6) 129 (63.5)
 Mid (4–8 cm from the AV) 419 (33.8) 353 (34.0) 66 (32.5)
 Upper (>8 cm from the AV) 32 (2.6) 24 (2.3) 8 (3.9)
Histologic type
 Well-differentiated 164 (13.2) 130 (12.5) 34 (16.7)
 Moderately differentiated 1,012 (81.6) 844 (81.4) 160 (79.8)
 Poorly differentiated 40 (3.2) 36 (3.5) 4 (2.0)
 Mucinous 17 (1.4) 15 (1.4) 2 (1.0)
 Signet ring cell 7 (0.6) 6 (0.6) 1 (0.5)
Lympho­vascular invasion (yes) 162 (13.1) 143 (13.8) 19 (9.4) 0.060
Perineural invasion (yes) 210 (16.9) 179 (17.3) 31 (15.3) 0.480
Distal resection margin (≤10 mm) 271 (21.9) 230 (22.2) 41 (20.2) 0.530
Circumferential margin (≤1 mm) 32 (2.6) 31 (3.0) 1 (0.5) 0.001
No. of harvested LN 17.8±7.6 19.7±6.8 8.3±2.4 <0.001
Pathologic T stage <0.001
 ypT0 180 (14.5) 143 (13.8) 46 (22.7)
 ypTis 4 (0.3) 3 (0.3) 1 (0.5)
 ypT1 64 (5.2) 50 (4.8) 14 (6.9)
 ypT2 333 (26.9) 274 (26.4) 59 (29.1)
 ypT3 643 (51.9) 560 (54.0) 83 (40.9)
 ypT4 7 (0.6) 7 (0.7) 0 (0)
Pathologic N stage <0.001
 ypN0 841 (67.8) 686 (66.2) 155 (76.4)
 ypN1 308 (24.8) 265 (25.6) 43 (21.2)
 ypN2 91 (7.3) 86 (8.3) 5 (2.5)
ypStage <0.001
 ypStage 0 181 (14.6) 137 (13.2) 44 (21.7)
 ypStage I 323 (26.0) 259 (25.0) 64 (31.5)
 ypStage IIA 335 (27.0) 288 (27.8) 47 (23.2)
 ypStage IIB 2 (0.2) 2 (0.2) 0 (0)
 ypStage IIIA 82 (6.6) 70 (6.8) 12 (5.9)
 ypStage IIIB 263 (21.2) 229 (22.1) 34 (16.7)
 ypStage IIIC 54 (4.4) 52 (5.0) 2 (1.0)
TRGa 0.008
 TRG 0 189 (15.2) 143 (13.8) 46 (22.7)
 TRG 1 280 (22.6) 240 (23.1) 40 (19.7)
 TRG 2 575 (46.4) 481 (46.4) 94 (46.3)
 TRG 3 196 (15.8) 173 (16.7) 23 (11.3)
Adjuvant chemotherapy (yes) 1,215 (98.0) 1,014 (97.8) 201 (99.0) 0.140

Values are presented as number (%) or mean±standard deviation.

LNY, lymph node yield; AV, anal verge; LN, lymph node; TRG, tumor regression grade.

aAmerican Joint Committee on Cancer/College of American Pathologists.

Table 2.
LN status according to TRGa in total patients and propensity score–matched patients
No. of LNs Total patients (n=1,240)
Propensity score–matched patients (n=609)
TRG 0 (n=189) TRG 1 (n=280) TRG 2 (n=575) TRG 3 (n=196) P-value TRG 0 (n=140) TRG 1 (n=136) TRG 2 (n=252) TRG 3 (n=81) P-value
Harvested LNs 15.6±6.6 18.2±7.8 17.9±7.6 19.3±7.9 <0.001 15.0±7.3 16.8±7.9 16.0±7.6 18.5±8.7 0.010
Positive LNs 0.1±0.6 0.6±1.6 1.0±2.1 1.3±2.5 <0.001 0.1±0.5 0.3±1.0 0.6±1.2 0.6±1.1 <0.001

Values are presented as mean±standard deviation.

LN, lymph node; TRG, tumor regression grade.

aTRG 0, complete response; TRG 1, moderate response; TRG 2, minimal response; TRG 3, poor response.

Table 3.
Clinicopathologic features of 1:2 propensity score–matched in good response group (tumor regression grade, 0–1)
Good response Before matching
After matching
LNY ≥12 (n=383) LNY <12 (n=86) P-value Cohen da LNY ≥12 (n=172) LNY <12 (n=86) P-value Cohen da
Sex 0.290 0.147 0.710 0.057
 Male 235 (61.4) 58 (67.4) 112 (65.1) 58 (67.4)
 Female 148 (38.6) 28 (32.6) 60 (34.9) 28 (32.6)
Age (yr) 57.4±10.3 60.3±8.7 0.008 0.289 59.9±8.7 60.3±8.7 0.700 0.046
Clinical T stage 0.360 0.087 > 0.990 0
 cT2 4 (1.0) 0 (0) 2 (1.2) 0 (0)
 cT3 353 (92.2) 83 (96.5) 162 (92.4) 83 (96.5)
 cT4 26 (6.8) 3 (3.5) 8 (4.7) 3 (3.5)
Clinical N stage <0.001 0.586 0.003 0.393
 cN0 27 (7.0) 20 (23.3) 18 (10.5) 20 (23.3)
 cN1 120 (31.3) 32 (37.2) 60 (34.9) 32 (37.2)
 cN2 236 (61.6) 34 (39.5) 94 (54.7) 34 (39.5)
Tumor location 0.850 0.022 0.670 0.057
 Low (0–4 cm from the AV) 251 (65.5) 59 (68.6) 119 (69.2) 59 (68.6)
 Mid (4–8 cm from the AV) 126 (32.9) 24 (27.9) 51 (29.7) 24 (27.9)
 Upper (>8 cm from the AV) 6 (1.6) 3 (3.5) 2 (1.1) 3 (3.5)
Histologic type 0.440 0.094 0.900 0.016
 Well-differentiated 83 (21.7) 24 (27.9) 43 (25.0) 24 (27.9)
 Moderately differentiated 273 (71.3) 57 (66.3) 118 (68.6) 57 (66.3)
 Poorly differentiated 20 (5.2) 2 (2.3) 9 (5.2) 2 (2.3)
 Mucinous 5 (1.3) 2 (2.3) 1 (0.6) 2 (2.3)
 Signet ring cell 2 (0.5) 1 (1.2) 1 (0.6) 1 (1.2)
Lymphovascular invasion (yes) 16 (4.2) 4 (4.7) 0.850 0.062 5 (2.9) 4 (4.7) 0.480 0.269
Perineural invasion (yes) 11 (2.9) 9 (10.5) 0.029 0.758 8 (4.7) 9 (10.5) 0.120 0.482
Distal resection margin (≤10 mm) 104 (27.2) 23 (26.7) 0.940 0.012 50 (29.1) 23 (26.7) 0.700 0.064
Circumferential margin (≤1 mm) 3 (0.8) 1 (1.2) 0.730 0.220 1 (0.6) 1 (1.2) 0.620 0.385
Pathologic T stage 0.001 0.378 0.670 0.049
 ypT0 143 (37.3) 46 (53.5) 94 (54.7) 46 (53.5)
 ypTis 1 (0.3) 0 (0) 1 (0.6) 0
 ypT1 27 (7.0) 8 (9.3) 15 (8.7) 8 (9.3)
 ypT2 122 (31.9) 22 (25.6) 48 (27.9) 22 (25.6)
 ypT3 89 (23.2) 10 (11.6) 14 (8.1) 10 (11.6)
 ypT4 1 (0.3) 0 (0) 0 (0) 0 (0)
Pathologic N stage <0.001 0.330 0.780 0.037
 ypN0 307 (80.2) 79 (91.9) 158 (91.9) 79 (91.9)
 ypN1 60 (15.7) 7 (8.1) 12 (7.0) 7 (8.1)
 ypN2 16 (4.2) 0 (0) 2 (1.2) 0 (0)
Adjuvant chemotherapy (yes) 368 (96.1) 85 (98.8) 0.070 0.685 162 (94.2) 85 (98.8) 0.049 0.914

Values are presented as number (%) or mean±standard deviation.

LNY, lymph node yield; AV, anal verge.

aStandardized mean difference.

Table 4.
Clinicopathologic features of 1:2 propensity score–matched in poor response group (tumor regression grade, 2–3)
Poor response Before matching
After matching
LNY ≥12 (n=654) LNY <12 (n=117) P-value Cohen da LNY ≥12 (n=234) LNY <12 (n=117) P-value Cohen da
Sex 0.330 0.115 0.630 0.064
 Male 460 (70.3) 77 (65.8) 160 (68.4) 77 (65.8)
 Female 194 (29.7) 40 (34.2) 74 (31.6) 40 (34.2)
Age (yr) 56.5±10.4 59.8±9.5 0.001 0.321 59.5±9.8 59.8±9.5 0.750 0.031
Clinical T stage <0.001 0.284 0.001 0.323
 cT2 2 (0.3) 1 (0.9) 0 (0) 1 (0.9)
 cT3 593 (90.7) 114 (97.4) 213 (91.0) 114 (97.4)
 cT4 59 (9.0) 2 (1.7) 21 (9.0) 2 (1.7)
Clinical N stage 0.008 0.269 0.037 0.238
 cN0 35 (5.4) 8 (6.8) 11 (4.7) 8 (6.8)
 cN1 189 (28.9) 49 (41.9) 75 (32.1) 49 (41.9)
 cN2 430 (65.7) 60 (51.3) 148 (63.2) 60 (51.3)
Tumor location 0.450 0.076 0.480 0.081
 Low (0–4 cm from the AV) 408 (62.4) 70 (59.8) 147 (62.8) 70 (59.8)
 Mid (4–8 cm from the AV) 227 (34.7) 42 (35.9) 79 (33.8) 42 (35.9)
 Upper (>8 cm from the AV) 18 (2.8) 5 (4.3) 7 (3.0) 5 (4.3)
Histologic type 0.120 0.158 0.380 0.100
 Well-differentiated 47 (7.2) 10 (8.5) 20 (8.5) 10 (8.5)
 Moderately differentiated 577 (88.2) 105 (89.7) 204 (87.2) 105 (89.7)
 Poorly differentiated 16 (2.4) 2 (1.7) 8 (3.4) 2 (1.7)
 Mucinous 10 (1.5) 0 (0) 1 (0.4) 0 (0)
 Signet ring cell 4 (0.6) 0 (0) 1 (0.4) 0 (0)
Lymphovascular invasion (yes) 127 (19.4) 15 (12.8) 0.060 0.288 40 (17.1) 15 (12.8) 0.280 0.186
Perineural invasion (yes) 168 (25.7) 22 (18.8) 0.090 0.221 52 (22.2) 22 (18.8) 0.460 0.116
Distal resection margin (≤10 mm) 126 (19.3) 18 (15.4) 0.290 0.150 48 (20.5) 18 (15.4) 0.230 0.193
Circumferential margin (≤1 mm) 28 (4.3) 1 (0.9) <0.001 0.908 6 (2.6) 1 (0.9) 0.460 0.615
Pathologic T stage 0.025 0.245 0.760 0.028
 ypT0 0 (0) 0 (0) 0 (0) 0 (0)
 ypTis 2 (0.3) 1 (0.9) 0 (0) 1 (0.9)
 ypT1 23 (3.5) 6 (5.1) 13 (5.6) 6 (5.1)
 ypT2 152 (23.2) 37 (31.6) 82 (35.0) 37 (31.6)
 ypT3 471 (72.0) 73 (62.4) 139 (59.4) 73 (62.4)
 ypT4 6 (0.9) 0 (0) 0 (0) 0 (0)
Pathologic N stage 0.024 0.202 0.640 0.054
 ypN0 379 (58.0) 76 (65.0) 157 (67.1) 76 (65.0)
 ypN1 205 (31.3) 36 (30.8) 69 (29.5) 36 (30.8)
 ypN2 70 (10.7) 5 (4.3) 8 (3.4) 5 (4.3)
Adjuvant chemotherapy (yes) 646 (98.8) 116 (99.1) 0.730 0.200 233 (99.6) 116 (99.1) 0.004 0.385

Values are presented as number (%) or mean±standard deviation.

LNY, lymph node yield; AV, anal verge.

aStandardized mean difference.

Table 5.
Univariate and multivariate analyses of risk factors affecting DFS and OS in good responders among the patients (tumor regression grade, 0–1) (n=469)
Variablea 5-yr DFS
5-yr OS
Univariate
Multivariate
Univariate
Multivariate
HR (95% CI) P-value HR (95% CI) P-value HR (95% CI) P-value HR (95% CI) P-value
Histologic type (WD/MD vs. PD/UD) 2.39 (1.26–4.54) 0.008 2.34 (1.22–4.48) 0.011 3.97 (2.09–7.52) <0.001 4.16 (2.16–8.01) <0.001
LVI (no vs. yes) 2.16 (0.99–4.68) 0.050 - - 2.09 (0.84–5.24) 0.120 - -
PNI (no vs. yes) 3.43 (1.71–6.86) 0.001 4.67 (2.19–9.98) <0.001 2.51 (1.08–5.84) 0.033 2.97 (1.15–7.66) 0.025
DRM ≤10 mm (no vs. yes) 0.86 (0.52–1.44) 0.560 - - 0.67 (0.35–1.28) 0.670 - -
CRM ≤1 mm (no vs. yes) 3.59 (0.88–14.65) 0.070 - - 1.81 (0.25–13.06) 0.560 - -
LNY (≥12 vs. <12) 0.91 (0.53–1.58) 0.740 - - 0.96 (0.52–1.78) 0.900 - -
ypT stage (ypT0–T2 vs. ypT3–T4) 3.03 (1.96–4.68) <0.001 2.44 (1.51–3.93) <0.001 2.21 (1.31–3.73) 0.003 1.79 (0.99–3.14) 0.050
ypN stage (ypN0 vs. ypN1–N2) 2.85 (1.81–4.49) <0.001 2.20 (1.32–3.69) 0.003 2.49 (1.45–4.25) 0.001 1.88 (1.02–3.46) 0.043

DFS, disease-free survival; OS overall survival; HR, hazard ratio; CI, confidence interval; WD, well-differentiated; MD, moderately differentiated; PD, poorly differenti­ated; UD, undifferentiated; LVI, lymphovascular invasion; PNI, perineural invasion; DRM, distal resection margin; CRM, circumferential margin; LNY, lymph node yield.

aThe variable listed first in the parenthesis is the reference category.

Table 6.
Univariate and multivariate analyses of risk factors affecting DFS and OS in poor responders among the patients (tumor regression grade, 2–3) (n=771)
Variablea 5-yr DFS
5-yr OS
Univariate
Multivariate
Univariate
Multivariate
HR (95% CI) P-value HR (95% CI) P-value HR (95% CI) P-value HR (95% CI) P-value
Histologic type (WD/MD vs. PD/UD) 1.97 (1.19–3.27) 0.009 1.57 (0.93–2.65) 0.090 2.28 (1.27–4.10) 0.006 1.69 (0.92–3.09) 0.090
LVI (no vs. yes) 1.88 (1.42–2.47) <0.001 1.25 (0.93–1.68) 0.130 1.93 (1.39–2.68) <0.001 1.26 (0.89–1.77) 0.190
PNI (no vs. yes) 2.30 (1.78–2.96) <0.001 1.59 (1.21–2.09) 0.001 2.41 (1.78–3.25) <0.001 1.64 (1.19–2.25) 0.002
DRM ≤10 mm (no vs. yes) 0.85 (0.61–1.18) 0.320 - - 0.90 (0.60–1.33) 0.590 - -
CRM ≤1 mm (no vs. yes) 2.29 (1.40–3.75) 0.001 1.35 (0.81–2.25) 0.250 2.83 (1.64–4.89) <0.001 1.68 (0.95–2.96) 0.070
LNY (≥12 vs. <12) 1.30 (0.95–1.79) 0.100 - - 1.27 (0.88–1.84) 0.210 - -
ypT stage (ypT0–T2 vs. ypT3–T4) 2.64 (1.88–3.72) <0.001 1.79 (1.24–2.58) 0.002 3.19 (2.06–4.94) <0.001 2.04 (1.28–3.24) 0.003
ypN stage (ypN0 vs. ypN1–N2) 2.43 (1.90–3.11) <0.001 1.85 (1.42–2.41) <0.001 2.70 (1.20–3.65) <0.001 2.06 (1.50–2.82) <0.001

DFS, disease-free survival; OS overall survival; HR, hazard ratio; CI, confidence interval; WD, well-differentiated; MD, moderately differentiated; PD, poorly differenti­ated; UD, undifferentiated; LVI, lymphovascular invasion; PNI, perineural invasion; DRM, distal resection margin; CRM, circumferential margin; LNY, lymph node yield.

aThe variable listed first in the parenthesis is the reference category.

REFERENCES

1. Jessup JM, Goldberg RM, Asare EA, Benson III AB, Brierley JD, Chang GJ, et al. Colon and rectum. In: Amin MB, Edge SB, Greene FL, Byrd DR, Brookland RK, Washington MK, editors. AJCC cancer staging manual. 8th ed. Springer; 2017. p. 251–74.

2. Betge J, Harbaum L, Pollheimer MJ, Lindtner RA, Kornprat P, Ebert MP, et al. Lymph node retrieval in colorectal cancer: determining factors and prognostic significance. Int J Colorectal Dis 2017;32:991–8.
crossref pmid pmc pdf
3. Kidner TB, Ozao-Choy JJ, Yoon J, Bilchik AJ. Should quality measures for lymph node dissection in colon cancer be extrapolated to rectal cancer? Am J Surg 2012;204:843–7.
crossref pmid
4. National Comprehensive Cancer Network (NCCN). Rectal cancer [Internet]. Version 2.2021. NCCN; c2021 [cited 2021 Feb 16]. Available from: https://www.nccn.org/professionals/physician_gls/pdf/rectal.pdf

5. Mechera R, Schuster T, Rosenberg R, Speich B. Lymph node yield after rectal resection in patients treated with neoadjuvant radiation for rectal cancer: a systematic review and meta-analysis. Eur J Cancer 2017;72:84–94.
crossref pmid
6. Ha YH, Jeong SY, Lim SB, Choi HS, Hong YS, Chang HJ, et al. Influence of preoperative chemoradiotherapy on the number of lymph nodes retrieved in rectal cancer. Ann Surg 2010;252:336–40.
crossref pmid
7. Xu Z, Berho ME, Becerra AZ, Aquina CT, Hensley BJ, Arsalanizadeh R, et al. Lymph node yield is an independent predictor of survival in rectal cancer regardless of receipt of neoadjuvant therapy. J Clin Pathol 2017;70:584–92.
crossref pmid
8. Tan L, Liu ZL, Ma Z, He Z, Tang LH, Liu YL, et al. Prognostic impact of at least 12 lymph nodes after neoadjuvant therapy in rectal cancer: a meta-analysis. World J Gastrointest Oncol 2020;12:1443–55.
crossref pmid pmc
9. Persiani R, Biondi A, Gambacorta MA, Bertucci Zoccali M, Vecchio FM, Tufo A, et al. Prognostic implications of the lymph node count after neoadjuvant treatment for rectal cancer. Br J Surg 2014;101:133–42.
crossref pmid pdf
10. Chan D, Tan KK. Lower lymph node yield following neoadjuvant therapy for rectal cancer has no clinical significance. J Gastrointest Oncol 2019;10:42–7.
crossref pmid pmc
11. Damin DC, Rosito MA, Contu PC, Tarta C, Ferreira PR, Kliemann LM, et al. Lymph node retrieval after preoperative chemoradiotherapy for rectal cancer. J Gastrointest Surg 2012;16:1573–80.
crossref pmid pdf
12. Wang Y, Zhou M, Yang L, Zhang J, Deng W, Shen L, et al. Prognostic value of lymph node yield in locally advanced rectal cancer with neoadjuvant chemoradiotherapy. J Clin Oncol 2018;36:15 Suppl:e15680.
crossref
13. Kim HJ, Jo JS, Lee SY, Kim CH, Kim YJ, Kim HR. Low lymph node retrieval after preoperative chemoradiation for rectal cancer is associated with improved prognosis in patients with a good tumor response. Ann Surg Oncol 2015;22:2075–81.
crossref pmid pdf
14. Hong YS, Nam BH, Kim KP, Kim JE, Park SJ, Park YS, et al. Oxaliplatin, fluorouracil, and leucovorin versus fluorouracil and leucovorin as adjuvant chemotherapy for locally advanced rectal cancer after preoperative chemoradiotherapy (ADORE): an openlabel, multicentre, phase 2, randomised controlled trial. Lancet Oncol 2014;15:1245–53.
crossref pmid
15. Edge SB, Compton CC. The American Joint Committee on Cancer: the 7th edition of the AJCC Cancer Staging Manual and the future of TNM. Ann Surg Oncol 2010;17:1471–4.
crossref pmid pdf
16. Awwad GE, Tou SI, Rieger NA. Prognostic significance of lymph node yield after long-course preoperative radiotherapy in patients with rectal cancer: a systematic review. Colorectal Dis 2013;15:394–403.
crossref pmid
17. Shvero J, Koren R, Marshak G, Sadov R, Hadar T, Yaniv E, et al. Histological changes in the cervical lymph nodes after radiotherapy. Oncol Rep 2001;8:909–11.
crossref pmid
18. Fajardo LF. Effects of ionizing radiation on lymph nodes. A review. Front Radiat Ther Oncol 1994;28:37–45.
crossref pmid
19. Shankar B, Premachandran S, Bharambe SD, Sundaresan P, Sainis KB. Modification of immune response by low dose ionizing radiation: role of apoptosis. Immunol Lett 1999;68:237–45.
crossref pmid
20. Bustamante-Lopez LA, Nahas C, Nahas SC, Marques C, Pinto RA, Cotti GC, et al. Pathologic complete response implies a fewer number of lymph nodes in specimen of rectal cancer patients treated by neoadjuvant therapy and total mesorectal excision. Int J Surg 2018;56:283–7.
crossref pmid
21. La Torre M, Mazzuca F, Ferri M, Mari FS, Botticelli A, Pilozzi E, et al. The importance of lymph node retrieval and lymph node ratio following preoperative chemoradiation of rectal cancer. Colorectal Dis 2013;15:e382–8.
crossref pmid
22. de Campos-Lobato LF, Stocchi L, de Sousa JB, Buta M, Lavery IC, Fazio VW, et al. Less than 12 nodes in the surgical specimen after total mesorectal excision following neoadjuvant chemoradiation: it means more than you think! Ann Surg Oncol 2013;20:3398–406.
crossref pmid pdf
23. Doll D, Gertler R, Maak M, Friederichs J, Becker K, Geinitz H, et al. Reduced lymph node yield in rectal carcinoma specimen after neoadjuvant radiochemotherapy has no prognostic relevance. World J Surg 2009;33:340–7.
crossref pmid pdf
24. Wang H, Safar B, Wexner S, Zhao R, Cruz-Correa M, Berho M. Lymph node harvest after proctectomy for invasive rectal adenocarcinoma following neoadjuvant therapy: does the same standard apply? Dis Colon Rectum 2009;52:549–57.
crossref pmid
25. Tekkis PP, Smith JJ, Heriot AG, Darzi AW, Thompson MR, Stamatakis JD, et al. A national study on lymph node retrieval in resectional surgery for colorectal cancer. Dis Colon Rectum 2006;49:1673–83.
crossref pmid


ABOUT
ARTICLE CATEGORY

Browse all articles >

BROWSE ARTICLES
AUTHOR INFORMATION
Editorial Office
Room 1519, Suseo Hyundai Venture-vill, 10 Bamgogae-ro 1-gil, Gangnam-gu, Seoul 06349, Korea
Tel: +82-2-2040-7737    Fax: +82-2-2040-7735    E-mail: editor@coloproctol.org                

Copyright © 2024 by Korean Society of Coloproctology.

Developed in M2PI

Close layer